It is well known that the catalysis of reactive gas mixtures is facilitated by plasma discharges. Many different plasmas, such as surface barrier discharges, have been shown to optimize the catalytic efficiency of silver/alumina or nickel/alumina used in traditional thermally activated reactors.
As part of the optimization, the onset temperature at which the efficient performance of the catalyst begins is lowered, and the overall efficiency of the process has been increased.
The synergistic behavior of plasmas and heated catalysts has been studied using a number of diagnostic techniques. The technique used is mostly specific to the observation of a particular reaction product. This article demonstrates the versatility of mass-spectrometric techniques to observe the behavior of typical plasma-assisted catalytic processes.
Instrumentation
The reactor is comprised of a quartz tube with a tungsten electrode running through it. The electrode is centralized and the catalyst is confined using quartz frit discs. Plasma is generated in the reactor using a number of excitation techniques available. A 0-3 Watt, 20 kHz supply is used to power the central electrode to take the measurements.
As a result, plasma is generated between the electrode and a grounded electrode surrounding part of the reactor tube, which also includes the volume taken by the powdered catalyst (Figure 1). The catalysts researched include nickel/alumina and palladium/alumina.
A mass-flow control system introduces the gases of interest using helium as the carrier gas. In future work, there are plans to use other carrier gases, including nitrogen.
.jpg)
Figure 1. The reactor, which consists of a quartz tube with a tungsten electrode running through it.
The capillary sampling connection is used for sampling the effluent gases from the reactor to the Hiden QGA Gas Analyzer (Figure 2). In the ionization source of the mass spectrometer, the pressure is reduced to or below 10-6 Torr using the capillary connection.
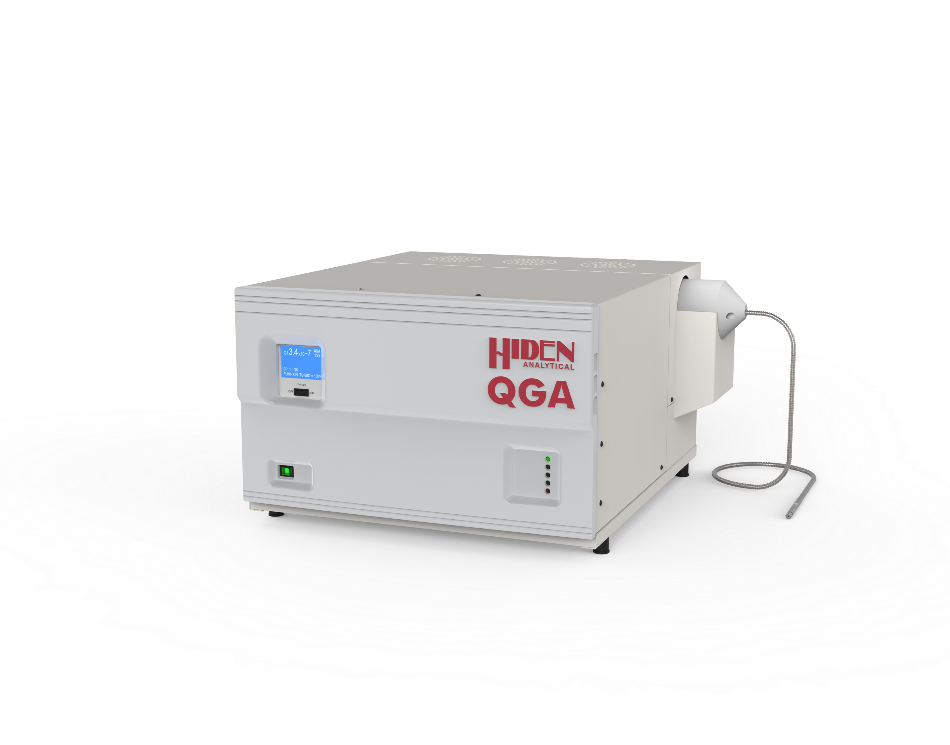
Figure 2. The Hiden QGA Gas Analyzer
Experimental Results
Oxidation of Carbon Monoxide
A typical mass scan for the sampling of a gas from the reactor while the input gas flow containing helium with 0.4% of O2 and 0.2% of CO is depicted in Figure 3a. The result of subtracting a scan collected when the plasma was turned off from the scan collected during plasma operation is shown in Figure 3b.
Both scans were collected at room temperature, clearly showing the generation of carbon dioxide to the detriment of oxygen and carbon monoxide.
.jpg)
.jpg)
Figure 3. a) Typical mass scan for the gas sampled from the reactor when the input gas flow consisted of helium containing 0.2% of CO and 0.4% of O2. b) The result of subtracting a scan taken when the plasma was off from one taken when the plasma was operating (both scans being taken at room temperature).
Figure 4 shows the carbon dioxide conversion during heating cycles of catalyst with or without the plasma being on. The plasma was off in the first cycle from 0-20 minutes, whereas the plasma was on between 26 and 38 minutes and again between 43.5 and 47 minutes, in the second cycle between 25 and 50 minutes. The rate of the heating cycle between 28 and 41 minutes was the same of power supplied to the heater during the first cycle.
.jpg)
Figure 4. The conversion to carbon dioxide during heating cycles when the catalyst was heated, with or without the plasma being on.
The effect of plasma was negligible when the catalyst was at a temperature much higher than its onset activation temperature, but became highly influential at lower temperatures between 43.5-47 minutes, when the heating power was turned off and the catalyst was cooling off.
The carbon dioxide signal remained unchanged at 38 minutes when the plasma was off. When the plasma was turned on, there was a reduction in the onset activation temperature at around 33 minutes.
From the time histories of all the masses analyzed from m/e = 10 to 50, the only mass, excluding 28, 32 and 44, that showed significant deviation with temperature or plasma on/off was found to be m/e = 16, presumably O+. This may have been generated from carbon dioxide in the source of the mass spectrometer.
It is possible that CO+ was also generated in a similar fashion resulting in the time difference of the m/e = 28 signal having two components: one is from the carbon dioxide generated and one directly from the carbon monoxide in the gas stream.
Dry Reformation of Methane
Palladium/alumina catalyst and a 3:1 mixture of methane and carbon dioxide with helium as carrier gas were used to perform the first tests for the methane reformation analyses. The primary reaction as described by Silverwood et al. is as follows:
CH4 + CO2 = 2CO + 2H2
Two heating/cooling cycles are shown in Figure 5, where the catalyst’s activation temperature was reached at 13 minutes when the plasma was turned off in the first cycle. There was a continuous increase in the formation of hydrogen and carbon monoxide until 27 minutes, when the heating was turned off. As a result, the reactor was cooled off, thus decreasing the hydrogen and CO intensities and recovering the m=16 CH4+ signal.
.jpg)
Figure 5. Two heating/cooling cycles
The plasma was on at 44 minutes, restarting the methane conversion. The reactor was now well below the activation temperature of the catalyst. When resumed, the heating of the reactor generated 20% higher hydrogen and CO for a particular temperature when compared to that in the absence of plasma.
The behavior of the H2O+ signal is also demonstrated by Figure 5. The H2O+ signal is generated following the reaction: H2 + CO2 = CO + H2O. The plasma had no effect on this reaction.
The impact of three 'plasma on' phases during a period following the achievement of optimum temperature by the reactor is depicted in Figure 6. The reactor temperature remained unchanged during 15-30 minutes and then lowered to below threshold activation by 40 minutes. The final 'plasma on' period illustrates the impact of conversion without catalytic contribution.
.jpg)
Figure 6. The effect of three ‘plasma on’ phases during a period after the reactor had reached its maximum temperature.
A Nickel/Magnesium oxide catalyst was used to perform similar experiments. One heating cycle is shown in Figure 7. The plasma operation was only for four shorter periods: 1:34, 2:19, 2:33 and 2:48h.
Although the effects were observable, they were not significant. It is not possible to explain the notable deviations in the relative abundances from 2:10 onwards since the reactor temperature remained unchanged from then until 2:40. However, it is an indication of deteriorating effectiveness of the catalyst.
.jpg)
Figure 7. A heating cycle
Conclusion
From the results, it is evident that the instrument is capable of observing the behavior of plasma-enhanced catalysis processes. The response of the Hiden QGA Gas Analyzer is rapid to any time-dependant variation of the products of the processes.
It may be possible to readily alter the relative positions of the catalyst and plasma regions of the reactor. Future analyses will explore the role of the carrier gas in measuring the contribution of the plasma to the reaction processes.

This information has been sourced, reviewed and adapted from materials provided by Hiden Analytical.
For more information on this source, please visit Hiden Analytical.