The LaserNetFines TM Q230 offers a unique, coordinated analysis of particulates with the help of imaging and magnetic sensing. With this patent-pending analysis capability, the instrument can perform unprecedented tasks.
Some of the unique capabilities of Q230 include characterization of the image of a particle of size 20 µm or above, and determination of the magnetic nature of the particle. The size of particles can be plotted, and the image-based vs. magnetic particle analysis can be compared.

Figure 1. SpectroLNF Q200 Particle Counter
Key Features and Advantages of Q230
The LNF Q230 provides unmatched, first-layer elemental analysis of the properties of debris, which no other instrument has provided so far. Its highly sensitive magnetometer enables the Q230 to examine tiny and dissolved particulates, and gives an overall ppm reading that includes the large particles.
The Q230 features two magnetic sensors which reveal intricate details that help in quantitative debris analysis for particles in the 0- 100 µm range. The operator can acquire this data within a very short duration of 15 seconds. Such a short processing time is achieved by integrating the magnetic analysis into the existing LNF Q2XX series setup, and streamlining the process using the magnetic sensing devices present in the normal imaging cell flow path.
Figure 2 depicts an example trace of the magnetic particulates present during analysis. Peaks represent individual magnetic particulates, and are identified and quantified using a peak detection algorithm that is embedded in the Q230. The start and end of an identified magnetic particle peak are indicated by red dots in the picture.

Figure 2. Example raw signal of the individual magnetic particles passing through the Q230. The peaks in the data indicate that anindividual magnetic particle has passed through the device. The red dots indicate the software’s determination of the beginning and end of each peak. The hatches on the top of each peak indicate the Q230’s determination of the height of each peak with the help of the built-in peak detection algorithm.
At a peak threshold of about 10 counts, and a 20 µm magnetic particle with a signature of 30 counts above the baseline, individual magnetic particles can be clearly seen down to 20 µm diameter.
Calibration and Validation of Q230
In order to maintain a high degree of accuracy and sensitivity during magnetic particle determination, the response of each Q230 unit is calibrated during the manufacturing process. This is validated with the help of LNF 545 check fluid prior to the shipment of the units. This fluid is composed of an almost monodisperse mixture of magnetic particles of size 42 µm. The magnetic particles in the fluid are homogeneously distributed, nanometer-sized, and have a calibrated overall magnetic content of 100 ppm. Before shipment, it is ensured that all Q230 units accurately determine the average particle size within ±5 microns.
The second sensor determines the total magnetic ppm of the sample under analysis. This is highly accurate across a wide range of environmental conditions. This sensor is subjected to a calibration test during manufacture, which requires the unit to consistently measure 0 ppm point within ±7 ppm. Each unit is subjected to an 8 hour solvent, temperature, and viscosity sweep for the above calibration test. During the final calibration step for the LNF Q230, it is ensured that the magnetic content is precisely determined up to ±10%.
The DC signal in the magnetometer when the fluid being analyzed is present in the flow line is compared with the DC signal when the solvent is present in the flow line, to determine these magnetic signals. Figure 3 depicts the trace of the response of the magnetometer to the magnetic fluid. A raw signal of 770 counts is produced by the 100 ppm sample.

Figure 3. Example magnetometer trace between when the cell contains a 100 ppm magnetic fluid (between approximately 5 - 8.5s) indicated by the dip in the signal when no magnetic fluid is in the cell. This shows the extreme sensitivity of the device to the presence of magnetic fluid.
The high accuracy of the magnetometer subsystem gives all manufactured Q230 units with identical sensitivity. In each manufactured unit of Q230, an instantaneous noise equivalent of 2.5 ppm is validated against an acceptable instantaneous magnetometer noise level of 20 counts during manufacture. Sub-ppm noise levels remain standard as the Q230 averages 2500 samples in a 5 s measurement time. The comparison of the magnetometer performance against the industry standards clearly shows the superior performance of this technology over the existing ones.
Figure 4 shows the repeatability of the magnetometer after 20 successive runs. The Q230 exhibits a 3 s repeatability of 2.5 ppm out of 33 ppm, which outperforms the best magnetometers available in the industry.
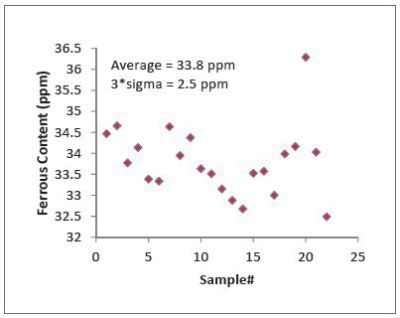
Figure 4. Example of the repeatability of 20 consecutive measurements.

This information has been sourced, reviewed and adapted from materials provided by AMETEK Spectro Scientific.
For more information on this source, please visit AMETEK Spectro Scientific.