Interest in studying mixed systems of pharmaceutical relevance is not a new concept. From intrinsic polymorphism to complex final products, the challenges encountered by modern analytical scientists have multiplied both in number and in complexity. Established techniques are often unable to provide both separation and identification of species in a mixed system, as they are used to probe chemistry (bulk spectroscopy), or individual particle characteristics (microscopy and SEM). Combining techniques capable of analyzing micronscale particulates with absolute chemical specificity provides a new window into describing the complicated mixtures common in today’s competitive pharmaceutical market.
Malvern Panalytical’ Morphologi G3-ID
The Morphologi G3-ID from Malvern Panalytical integrates automated microscopy and spectroscopy in a single system. This combination is called Morphology Directed Raman Spectroscopy (MDRS). Raman spectroscopy can detect the exotic polymorphic forms of a material and perform single particle analysis to identify the long-term stability of a product.
Morphological results are correlated with spectroscopic results however spectra can be similar for morphologically distinct particle groups. MDRS’ ability to target morphologically distinct particles for raman analysis increases the measurement sensitivity by avoiding the measurement of an unwanted particles spectra. Since a common morphology may describe a particle group with similar spectra, analysts can also evaluate the particulate quantity without having to individually measure a spectrum for each particle in a morphologically-similar group. Such correlations between chemical identity and particle morphology mean MDRS has improved efficiency over manual techniques.
Experimental Procedure
The Morphologi G3-ID was used to investigate a polymorphic mixture of common pain-relief medication for sample analysis to determine the chemical identify, shape, and size of sample particulates. Type I and Type II polymorphs of acetaminophen or paracetamol were present in the polymorphic mixture. Recrystallization of Type I form of acetaminophen was carried out by the slow cooling of a saturated aqueous solution at 60°C. This was followed by recovering and drying the resulting material at 75°C for 8h. At this point half of the sample (Type I) was separated and the other half was subjected to heating at 170°C to obtain the Type II polymorphic form. Milling of a volumetric fraction containing Type I and Type II at a mixing ratio of 9:1 by weight was carried out in a hand mill for one minute. Around 3mm3 of the resulting mixed powder was introduce into the dry dispersion accessory of the Morphologi G3-ID for subsequent dispersion at 4 bar pressure onto a quartz plate.
Acetaminophen particles were detected by scanning a 20 mm diameter area at 5x magnification. For raman measurement, 1375 particles were chosen based on size categories of 50 µm, 25-50 µm, and 10-25 µm. For raman analysis, reference spectra were collected from pure materials. A 20 mW, 785 nm laser was used to illuminate a 3 µm spot size at 50x magnification to obtain spectra at 6cm-1 resolution, covering a spectral range of 150- 1850 cm-1.
Experimental Results
For the 9 (Type I):1 (Type II) acetaminophen mixture more than 70,000 individual particles were determined. Figure 1 illustrates the particles studied and their final size distribution. The use of hand mill gave a large range of particle sizes, as observed from the high size distribution in the morphological results. The results also showed the presence of a few large particles with a size greater than 200µm in the final dispersion. Size distribution results are useful to categorize particles based on their size for subsequent Raman analysis. Particles with a size less than 10µm were not considered for the raman investigation.
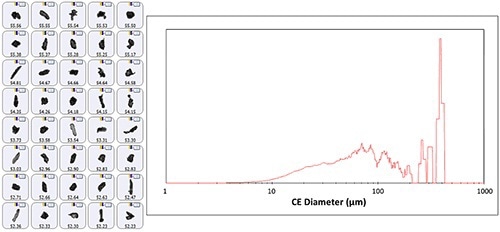
Figure 1. Representative particle images from the polymorph acetaminophen mixture (left panel) and the size distribution (volume weighted, right panel).
When the results were correlated against a library of pure polymorph spectra it was found that out of 1375 particles 1220 were Type I particles and 144 were Type II particles. This corresponds to a 10.5% Type II polymorph. Figure 2 shows the pure reference spectra and the individual spectra for each polymorph. The correlation was limited to the range of 1200-1260 cm-1 and 1540-1590 cm-1, a region where the two forms can be clearly differentiated. There must be a correlation score of more than 0.85 to confirm the presence of either Type I or Type II.
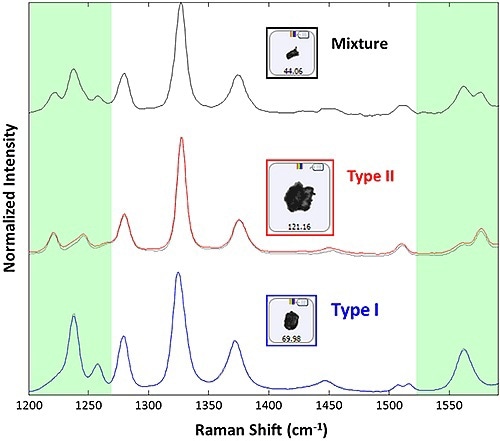
Figure 2. Raman spectra collected from example particulates for acetaminophen Type I (blue), acetaminophen Type II (red), and a mixture spectrum (black). The Type I and Type II spectra are superimposed over reference spectra used to create the library (black dotted). The portions of the spectrum in green are those used for correlation to the reference library.
The recorded spectra were in excellent agreement with library spectra allowing for the differentiation between the two polymorph types within the limitations of the correlation analysis. Aggregates formed during dispersion may be the cause of the mixture spectra observed for subset particles. It is possible to review the morphologies of the two types after obtaining the spectroscopic data to conclude the possibility of segregating similar looking substances based on their morphologies. From the results, it can be concluded that the Intensity Mean is higher for the Type I particles when compared to the Type II particles, corroborating the higher transparency of Type I particles (Figure 3).
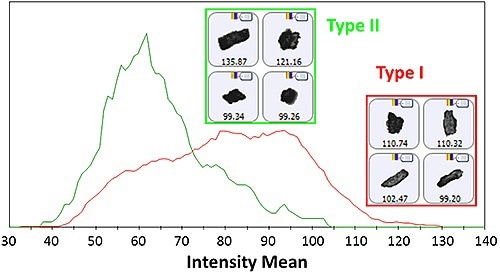
Figure 3. Intensity Mean distribution for the Type I and Type II particles as determined by the Raman spectroscopic results. Insets display example images of particles from each group.
However, the Intensity Mean distributions overlap at some points suggests that it is not a reliable morphological separator. No other morphological descriptors showed a considerable variation between the types of particles mainly due to loss of morphological data during the milling process. As a result, it is necessary to have a “referee” method like Raman spectroscopy to discern the different chemical species available in samples.
The pharmaceutical industry faces a continuous problem in the form of polymorphic conversions. A drug substance can be transitioned from a stable, efficacious form into an undesired structural analog either over time or due to improper storage and process conditions. Therefore it is important for both innovators and generic pharmaceutical companies to establish the existence of multiple polymorphic forms.
Vibrational spectroscopy has the sensitivity to detect multiple polymorphic forms present in a mixed system. However, widely used bulk spectroscopic techniques do not have the sensitivity to establish the presence of low levels of polymorphic contaminants in final products. Additionally, with these techniques only an overview of a material in the sample area can be obtained and it is not possible to partition the sample into individual particles in order to obtain specific characterization.
Conclusion
MDRS thus provides clear advantages over traditional methods of vibrational spectroscopy, and is well-suited to address low-level polymorphic contamination directly. Spectra are collected for single particles, which allow at least an order of magnitude increase in detection sensitivity. Data collection can be conducted for any number of particulates desired, and unique spectra are easily identified.
As mentioned previously, the morphological characteristics of particulates can also be used to further refine the selectivity of the method. If different polymorphic forms have distinct morphology, the method can be modified to investigate only those that fit a particular morphological profile. These strengths position MDRS as a technique that can handle the most difficult polymorphic mixtures with unparalleled sensitivity and flexibility, providing a new tool for root cause analysis, product quality, and formulation development.

This information has been sourced, reviewed and adapted from materials provided by Malvern Panalytical.
For more information on this source, please visit Malvern Panalytical.