Severe engine damage can occur due to fuel dilution in lubricating oil, as high fuel levels (>2%) in a lubricant can lead to decreased viscosity, loss of dispersancy, oil degradation, and loss of oxidation stability. In internal combustion engines, fuel dilution is a major cause for lubricant failure and typically occurs as a result of not only improper fuel-to-air ratio, but also due to piston ring wear, excessive idling, or loose connectors, and defective injectors.
Measurement Techniques
Gas Chromatography
The most commonly used direct technique for the analysis of fuel dilution in lubricants is gas chromatography (GC) based on ASTM methods D3524, D3525, and more recently, D7593 (Figure 1). In this technique, a portion of the oil sample is injected into a gas chromatograph that vaporizes the sample and sends it through an analytical column, which splits the sample into its component hydrocarbons in the order of boiling point.
Quantitation is achieved through integration of the area of fuel peaks that are detected by a flame ionization detector (FID). A calibration curve is generated for associating the peak area to mass percentage of fuel in the oil sample. At times, an internal standard such as diesel or decane is used so as to calibrate the ratio of the integrated area of the fuel peaks in comparison with the area of the internal standard peak.
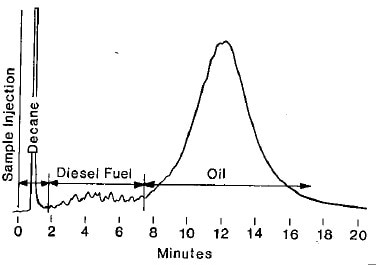
Figure 1. ASTM D3524: Typical gas chromatogram of diesel fuel contamination in oil.
While this technique ensures precise results, it can be applied only for high volume labs as they are costly and mandate skilful technicians. Sometimes there is an overlap in boiling points between the fuel and specific engine oil formulations, and thus achieving the best result by the GC technique can be highly time-consuming.
Such overlaps can also cause errors of up to 2% fuel dilution if they are not checked. In these cases, the pressure, temperature, or column may have to be optimized for the particular oil type. A number of commercial labs have redesigned the conventional ASTM methods to utilize a much robust and faster technique developed by a leading GC manufacturer. Figure 2 illustrates a schematic diagram of a gas chromatograph, and Figure 3 depicts a Thermo Scientific gas chromatograph.
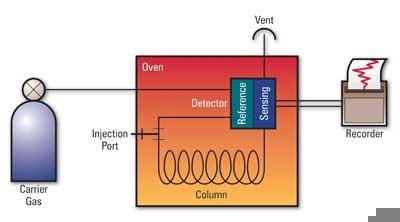
Figure 2. Schematic of a gas chromatograph. The sample is injected into the instrument and vaporized. It is then carried through the analytical column by an inert gas that separates the sample according to molecular structure (boiling point). The presence of each analyte is detected as it passes through the detector and exit vent of the instrument and is converted to signal peaks on a chromatogram.
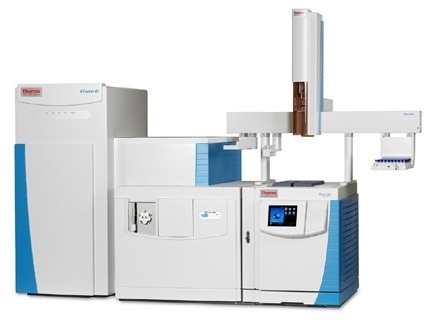
Figure 3. GC-MS courtesy of Thermo Scientific.
Following are the advantages and disadvantages of the GC technique:
Advantages:
- Widely accepted industry standard
- Highly precise
- Suited for high volume labs
- Can detect biodiesel and ethanol
Disadvantages:
- Can only be carried out in a lab
- Mandates costly equipment and gases
- Takes much time to produce best results
- Requires an expensive equipment and gases
Viscosity Analysis
The viscosity of a lubricant is regularly analyzed as part of a basic set of tests for testing the lubricant condition. A number of techniques and instruments exist for both field and lab testing, such as the Spectro Q3050 portable kinematic viscometer.
Fuel dilution in a lubricant can be indirectly detected by testing viscosity as it appears as a change from uncontaminated oil. Nevertheless, a mere change in viscosity of the lubricant cannot be concluded as a fuel dilution problem, because a number of other lubricant problems such as contamination (coolant, water, soot), lubricant degradation, topping off with inappropriate oil, and so on can also be caused due to the change in viscosity. Viscosity should only be used as a screening test to encourage further testing of contaminated samples, if necessary.
Following are the advantages and disadvantages of the viscosity test:
Advantages:
- The availability of portable instruments and lab instruments
- Accepted routine test for testing lubricant condition
- Optimum screening test for probable fuel dilution
- Ability to detect ethanol and biodiesel
Disadvantages:
- Inability to definitively indicate fuel dilution issue
- Mandates a careful technician
Flash Point Testing
Another standard technique that has been used for many decades for analyzing new as well as used lubricants is the flash point testing. It can detect the presence of fuel dilution in a used oil sample. The lowest temperature at which an ignition source ignites the vapors of the sample under predetermined conditions is called as the flash point. The flash point temperature is decreased if there are lighter hydrocarbon fuel components in a sample.
One favored method for carrying out flash point testing is ASTM D3828, or the small-scale closed cup process (Figure 4). In this process, as little as 2 mL of the sample is rapidly heated to a temperature (e.g. 25°C) lower than the new oil baseline by a predetermined amount for a pass/fail test. The ignitor is applied as soon as the target temperature is attained. If a flash is observed, the test denotes a probable fuel dilution.
For better quantitative results, multiple temperature points can be tried, and correlation tables generated for known samples, can be used to convert the flash point temperature into fuel dilution percentage. As one may not be familiar about the engine oil type or fuel type, the actual percentage of fuel dilution cannot be determined easily. Therefore, flash point testing is usually used only as a qualitative pass/fail test. Figure 4 shows a Setaflash Series 3 closed cup flash point tester used for flash point testing.
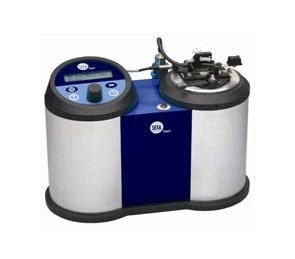
Figure 4. Setaflash Series 3 closed cup flash point tester (ASTM D3828).
Following are the advantages and disadvantages of flash point testing:
Advantages:
- A pass/fail result is enough in the case of most applications
- Ability to detect ethanol
- Very little sample required (1-2 mL)
Disadvantages:
- Inability to detect biodiesel
- Mandates a careful technician
- Knowledge of the oil/fuel type mandatory for quantitative measurement
- Risks posed by heating fuel-laden samples
FTIR Spectroscopy
FTIR spectroscopy enables a user-friendly and fast measurement of fuel dilution. However, distinguishing between the fuel hydrocarbons and the hydrocarbons present in the base oil is highly difficult, and precise results are harder to achieve. Calibration mandates large datasets for a narrow sample type to develop complex algorithms for correlating the spectrum with the fuel dilution (Figure 5). Therefore, FTIR is not broadly applied for fuel dilution measurement.
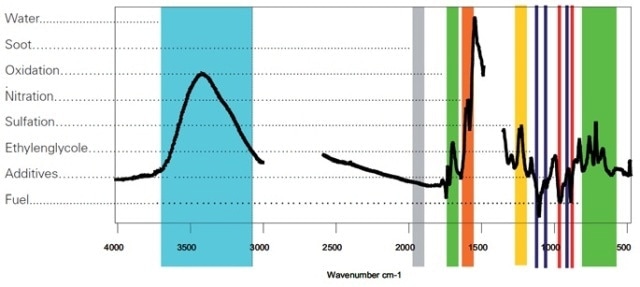
Figure 5. The spectrum above shows the difference spectrum of used-oil versus a new-oil reference. The areas (as marked) are used for the determination of the compounds.
Following are the advantages and disadvantages of the FTIR spectroscopy method:
- Advantages: Low cost per sample after initial equipment purchase; test can be carried out quickly.
- Disadvantages: Mandates the use of costly equipment; calibrations are mostly specific to a narrow sample type.
Surface Acoustic Wave Sensing
The Spectro Q6000 Fuel Dilution Meter (FDM) (Figure 6) includes a surface acoustic wave (SAW) sensor that responds particularly to the presence of fuel vapor.
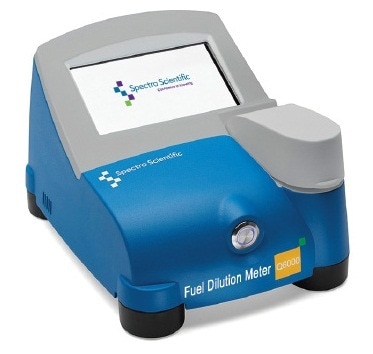
Figure 6. Spectro Scientific Fuel Dilution Meter.
It works based on the principle of Henry’s law. The quantity of fuel diluted in the oil taken in a closed sample container is directly proportional to the quantity of fuel vapor in the headspace of the container at equilibrium (Figure 7).

Figure 7. The concentration of fuel vapor present in the headspace of a closed bottle at equilibrium is proportional to the amount of fuel present in solution.
A 0.5 mL sample is located on a small felt pad at the bottom of a disposable vial (Figure 8), and the vial is left to equilibrate for a minute. The FDM then employs a fang design to puncture the cap and sample the vapor in the headspace.
As it is a direct, simple, and portable instrument, the FDM can be used both in the field and laboratory. It can be used by reliable professionals without any in-depth training or experience, and can detect fuel dilution in the range of 0%-15% with an LOD of 0.2% fuel dilution. The FDM has <5% RSD of repeatability and an accuracy of ±10% of measurement, i.e. minimum 0.2% fuel dilution.

Figure 8. Sample vial used to test small amounts of oil.
Following are the advantages and disadvantages of the Spectro Q6000 Fuel Dilution Meter:
Advantages:
- Easy to use
- Portable
- Requires only 0.5 mL of sample
- Less expensive than gas chromatographs
- Can complete the test quickly
- Easily adaptable to different oil/fuel types
Disadvantages:
- Inability to measure biodiesel
- Mandates calibration with a reference fluid
Conclusion
Fuel dilution is a highly critical lubricant contamination problem that can cause severe engine damage. A number of techniques exist to measure fuel dilution. Viscosity analysis is a significant screening technique that is conventionally performed for testing the used lubricants. Gas chromatography, flash point testing, and surface acoustic wave sensing are direct techniques for testing fuel dilution. However, choosing the appropriate method always depends on the application requirements.

This information has been sourced, reviewed and adapted from materials provided by AMETEK Spectro Scientific.
For more information on this source, please visit AMETEK Spectro Scientific.