Surface topographies can have certain limitations during all manufacturing procedures. Such limitations can be partly represented by crossover scales. Therefore, it is imperative to get a better understanding of these crossover scales for choosing process variables in additive manufacturing (AM) as well as for designing tooling for AM, which can enhance surface textures.
In this case study, the quantified topographies on surfaces produced by the AM process for polymers are studied in detail. The nature of the topography changes in crossover scales. Multi-scale analysis of area and length, and their derivatives with regard to scale, were used to establish crossover scales. Such analysis uses methods that are developed to construct consistently approximate solutions, which have been validated for both large and small values of individual variables.
Manufactured surfaces can appear smooth at adequately large scales, but appear rough at adequately fine scales. Smooth-rough crossover (SRC) refers to the scale at which this change occurs. In some respects, surfaces produced in AM are identical to other types of manufactured surfaces. Finer topography components can rely on the fine-scale tool-material interactions, and larger topography parts can be susceptible to the process variables.
Roughness can exhibit larger scale features with a high degree of regularity, which relies on the thickness of the layer. There are certain features that have significant irregularity at finer scales, and these features may depend on the material deposition technique (flow and curing).
Methodology
In this analysis 10 mm cubes with a single edge beveled at an angle of 45° (Figure 1) was developed using a Dimension SST 1200ES Fused Deposition Rapid Prototyping Machine; 250 and 330 µm-thick layers were used. Next, using a thermoplastic extrusion in a semi-liquid state of ABS, components were produced in a layer by layer fashion. The exterior boundary of individual layers was deposited, and the interior was subsequently filled.
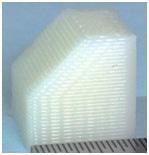
Figure 1. Macrograph of the part (10 mm cube with an angled bevel made with 330 µm layers).
Fused deposition rapid prototyping or fused deposition modeling (FDM) is an AM process that is often utilized for prototyping, modeling, and production applications. In this example, prototype components were produced using thermoplastic extrusion, where the raw plastic is melted and formed into a continuous profile.
An Evident LEXT OLS4000 laser scanning confocal microscope, equipped with the 100x lens was used to conduct surface measurements on the angled bevel face, sides, and top edge. Extended regions were covered by combining separate measurements. 121 x 121 µm was the size of the individual region measurement containing 1024 x 1024 elevations with an initial sampling interval of 227 nm. During the initial stitching operation, changes were made to this initial sampling interval.
Many unusual spikes or heights are likely to occur in the narrow areas between the layers, they can be removed using a slope filter in the Mountains 7 software. This technique removes unlikely height measurements without changing the rest of the measurement. The surrounding average heights were used to replace the heights where the spikes were removed, leading to some smoothing of the measurement where the spikes had been substituted. Despite smoothing the measurement, this approach makes measurements useful by removing impractical artifacts, which would considerably increase the relative areas and lengths.
In order to prevent large defects in the surfaces the measured regions were considered. The Mountains 7 software was used to perform this process, and to turn the measurements into images (Figure 2). Using Sfrax fractal analysis software multi-scale analyses of the relative surface areas and the relative profile lengths were respectively carried out on surface sections and profiles that were perpendicular to the deposited layers. Cross sections of three deposited layers are included in the chosen regions (Figure 2).
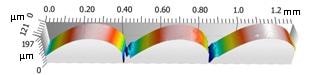
Figure 2. Rendering of surface measurements from side (above) and angled bevel (below) with 254 µm layers.
Line segments are used by length-scale analysis in continual tiling exercises at varied scales to establish profile lengths as a function of scale. The scale, represented by the line segment length, remains constant in each tiling exercise. At each scale, relative lengths are established from the ratio of the quantified profile length to its straight-line or nominal length.
This is followed by measuring the relative lengths across a range of scales from the length of the profile to the sampling intervals. Multi-scale analysis of the relative areas were carried out on specific crests where there is a bulging of the layer. Area-scale evaluations are analogous to length-scale analysis. Instead of relative lengths, relative areas are established, and instead of line segments, triangles are utilized to tile areal measurements [z=z(x,y)] and not profiles [z=z(x)].
Multi-scale differentiation testing was carried out on relative areas as well as on their complexities at all of the scales in preferred regions and they were then measured from a section of the measurement (192 x 192 µm) of the maximum region on one of the layers deposited (Figure 2).
Form was eliminated using a second order filter in the Mountains 7 software. These regions were divided into four separate sections (2 x 2) in the Sfrax fractal analysis software to promote statistical comparisons between the surfaces. The mean square ratio (MSR), determined by an F-test, was compared against key values to establish the level of confidence for differentiating the surfaces according to their relative areas at individual scales. The MSRs are plotted against the scale.
Results
Figure 2 shows the renderings of the chosen surface portions determined from the angled bevel and side of the cube with a 254 µm-thick layer. It can be seen that height replacements have smoothen the topographies present in the valley regions between the layers following spike filtering. Table 1 shows the values of standard parameters for the four surfaces.
Table 1. ISO 25178 height and hybrid parameters (ISO, 2012)
| parameter → |
height (µm) |
hybrid |
| surface ↓ |
Sa |
St |
Sq |
Sp |
Sdq |
Sdr % |
| 254 side |
18.3 |
66 |
20.9 |
25.9 |
0.83 |
21.9 |
| 330 side |
24.3 |
139 |
28.2 |
39.3 |
4.29 |
51.2 |
| 254 angled |
37.1 |
159 |
43.5 |
49.7 |
2.22 |
58.4 |
| 330 angled |
40.1 |
197 |
48.2 |
56.9 |
2.28 |
48.4 |
Figure 3 shows the plots of the relative lengths against scale for profiles in the longitudinal direction from the angled bevel and side surfaces (Figure 2). Multi-scale analysis of the relative lengths can be done to define three different regions of scale. The relative lengths differ frequently and continue to remain close to each other at large scales, above 350 µm and 250 µm, for the angled and side respectively. There is a transition region between the larger scales and a scale of 30 µm for both surfaces, where the relative lengths are likely to increase irregularly. At less than 30 µm scales, the relative lengths increase continuously, albeit at a lower rate with regard to decreasing scale, until reaching the sampling intervals of 300 to 400 nm.
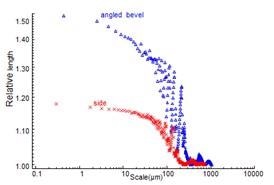
Figure 3. Relative lengths vs. scales for side and angled bevel surfaces with 254 µm layers.
Figure 4 shows the details of the two crossovers between the three areas for relative length. The relative lengths slightly increase at the largest scales, again returning to values close to one. This occurs twice before definitively increasing to larger values at all of the finer scales. Prior to definitively increasing at the finer scales, the finest scale where the relative length reaches one can be marked as a kind of SRC. Figure 5 shows the plotted SRC values. At the intermediate scales, the irregularity of the relative length seems to be quasi-periodic, in a sequence of waves.
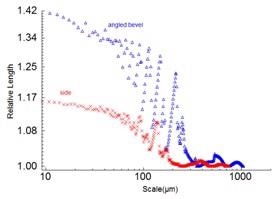
Figure 4. Larger scale details of the relative lengths vs. scales for side and angled bevel surfaces with 254 µm layers.
The SRC appears to increase in a linear fashion with the altered layer thickness (Figure 5). The SRC and the layer thickness are seen to be strongly correlated. The slope is roughly 0.9, the regression coefficient (R²) is more than 0.99, and the intercept is below 10% of the mean value of the SRCs.
The height parameters given in Table 1 will also augment monotonically if plotted as in Figure 5. These similar trends with the SRC are in line with the principle that these height parameters are sensitive to some of the larger scales in the measurements. Also, the hybrid parameters are highly sensitive to the finest scales, and do not exhibit comparable increases with the altered layer thicknesses.
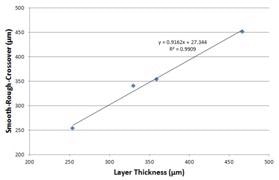
Figure 5. Smooth-rough crossovers vs. layer thickness and modified thickness for the bevels.
Comparison of the length-scale complexities is made between the bevel and side for all of the scales for the 330 µm and 254 µm layers, respectively (Figure 6). In either case, the angled surfaces are likely to exhibit more complexities than the sides. A noticeable decrease can be seen in the complexity in all cases at the finer scales. However, there is no reliable proof of any tendency toward a general complexity at the finest scales.
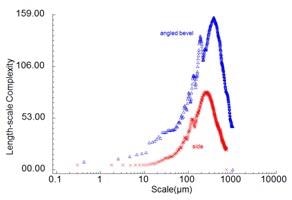
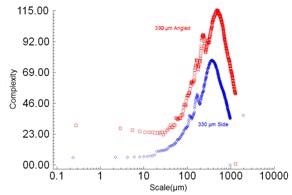
Figure 6. Length-scale complexity vs. scale for the 254 µm layer (above) and 330 µm layer (below).
Figure 7 shows the rendering of surfaces utilized for the area-scale analysis aquired from crests of the layer bulges. Figure 8 shows the relative areas, which are the outcomes of the areal multi-scale analysis from the selected crest regions, against areal scales.
In this analysis, the largest linear scale is approximately 30 µm, which is much below the SRC for relative lengths. Further, the linear scale is 50% the square root of the triangular areal scale. With the form removed, the relative areas trend toward one at the largest scales for all surfaces. In these regions, with the form removed, the SRCs are approximately 5 µm or 100 µm². No relation is seen between the large-scale processes and relative areas.
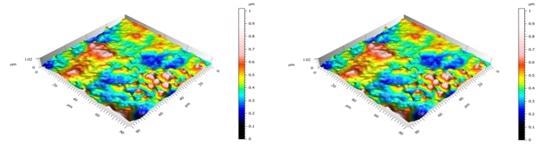
Figure 7. Extracted region with form removed from 254 µm crests, side (left) and angled bevel (right).
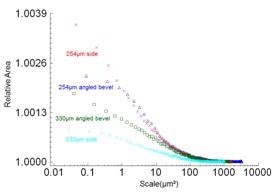
Figure 8. Relative areas vs. scale from the selected crests from the all of the surfaces.
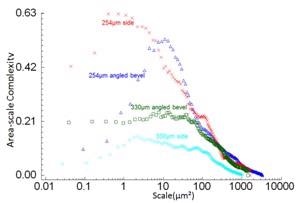
Figure 9. Area-scale complexities shown versus scale for the selected regions. All the surfaces have maximum complexities between 0.4 and 20 µm².
Figure 9 shows the area-scale complexities against scale for the selected regions. Figure 10 shows the outcomes of multi-scale differentiation testing using F-tests on the complexities at individual scales. The MSR is plotted against scale, indicating 99.9% for the critical MSR. In both these comparisons, the capability to distinguish is reliably strong below scales of 20 µm², but strongest at 10 µm², and then decreases at the finer scales. As indicated by the MSR values (Figure 10), the capability to distinguish the side surfaces is higher than it is for the angled bevel surfaces.
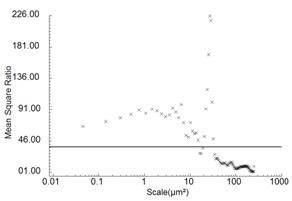
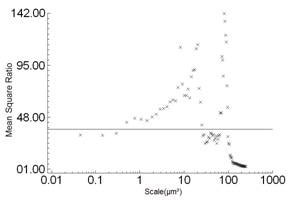
Figure 10. Multi-scale discrimination from area-scale complexity vs. scale from selected crests from the sides (above) and bevels (below) of 254 and 330µm layers.
Conclusion
Different aspects of the topographies at different scales can be detected through multi-scale analyses of the roughness of the combined deposition parts. The main conclusions from this case study are summed up below:
- Utilizing area-scale and length-scale tilings, multi-scale analyses are capable of differentiating regions in scale with clearly different natures.
- A high degree of regularity is shown by the relative lengths at scales similar to the layer thickness and higher. The period relies on the surface orientation and layer thickness.
- The layer thickness seems to be directly associated with the scale of the SRC on the length-scale plot.
- The SRC determined from measurements of the angled bevel region is proximal to the layer thickness times the sine of 45°.
- At the crests of the layer bulges, the area-scale complexities considerably vary between the parts at scales less than approximately 20 µm².

This information has been sourced, reviewed and adapted from materials provided by Evident Corporation - Industrial Microscopy.
For more information on this source, please visit Evident Corporation - Industrial Microscopy.