Viral glycoproteins (vGPs) play a significant part in the binding and fusion of host cell membranes and virus. Neutralizing antibody responses also target vGPs as their primary mark.
A majority of surface vGPs take the form of oligomeric complexes of tetramers, trimers, or dimmers (Figure 1). When designing post-exposure antibody treatments or developing vaccines, it is important to know if various antibodies bound to these complexes, and if they do with what affinity.
For example, contemporary treatments target Ebola virus GP and scientists are exploring new igGs for their effectiveness in therapeutic cocktails (Murin et al. 2014).
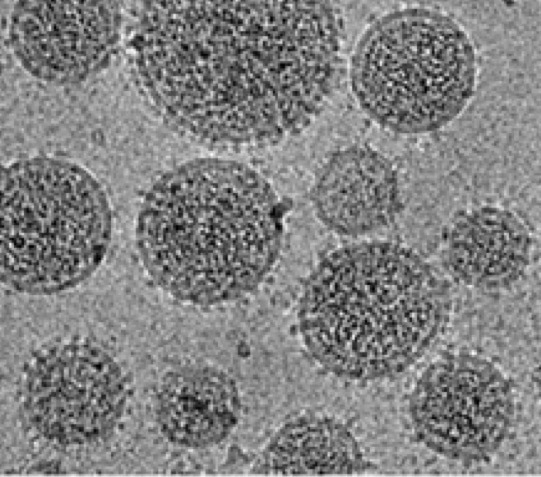
Figure 1. Electron micrograph of viral particles studded with glcyoproteins
Any change in apparent weight-average molar mass (Mw) as a function of composition is quantified by composition-gradient multi-angle light scattering (CG- MALS). This enables the reversible associations in solution.
The stoichiometry and affinity of different protein-protein association can be evaluated, in a solution using CG-MALS. In this experiment, CG-MALS are employed to trace the interaction between a neutralizing antibody (IgG) and a dimeric viral glycoprotein (vGP).
Materials and Methods
Reagents
vGP was created through recombination of insect cells and the affinity is purified before SEC-MALS. IgG was recombinantly produced from the plasmids in mammalian cells that encode light and heavy chains.
Protein A affinity capture purifies the IgG. All tests were conducted in pH 7.5, 150 mM NaCL (TBS) and 25 mM Tris.
SEC-MALS and Protein Conjugate Analysis
An AKTA purifier FPLC compatible with the OptilabT-rEX differential refractive index detector and miniDAWN TREOS MALS detector, and an S200 10/30 column (GE Healthcare) were used to conduct SEC-MALS experiments.
The ASTRA software was used for the collection and analysis of data. ASTRA’s protein conjugate analysis was employed to evaluate a corrected extinction coefficient and dn/dc to determine the glycan content, and also to determine the protein ratio for vGP.
Determination of Equilibrium Constants
A Calypso II composition gradient system was used for the CG-MALS tests to produce various compositions of glycoprotein, antibody, and buffer, and to send it to an online UV detector (GE) and the miniDAWN TREOS. To filter the buffer and sample, polycarbonate (Millipore) filter membranes, with a pore size of 0.1 µM, were incorporated in the Calypso.
IgG and vGP were watered down to a concentration of 50 µg/mL in TBS. Anotop (Whatman) syringe filters were used to filter all the solutions to 0.02 µM, which were then loaded onto the Calypso II.
To evaluate the self associations and hetero-associations in vGP, the automated Calypso technique used a single component gradient and a dual-component “crossover” gradient, respectively.
In order to prepare the various compositions, 0.7 mL of protein solution was administered into the MALS and UV detectors. They were then left to reach equilibrium inside the MALS flow cell.
For the GP hetero-association gradient, the flow was halted for a period of 300 seconds, while for the self-association the flow was halted for 60 seconds. The CALYPSO software was used to collect and analyze the data.
The extinction coefficient and dn/dc obtained by the SEC-MALS for the conjugate were employed to analyze the CG-MALS data.
Results and Discussion
Glycoprotein Characterization
The average molecular weight of the oligomeric state and glycoprotein were evaluated by examining the vGP using SEC-MALS, before it was examined by CG-MALS. Protein conjugate analysis can be conducted to evaluate vGP’s glycan content by merging the RI and UV concentration signals.
The glycan content in both the injections shown in Figure 2 made up ~17% of the total mass of vGP. A corrected extinction coefficient and dn/dc value was obtained for further CG-MALS research through this characterization.
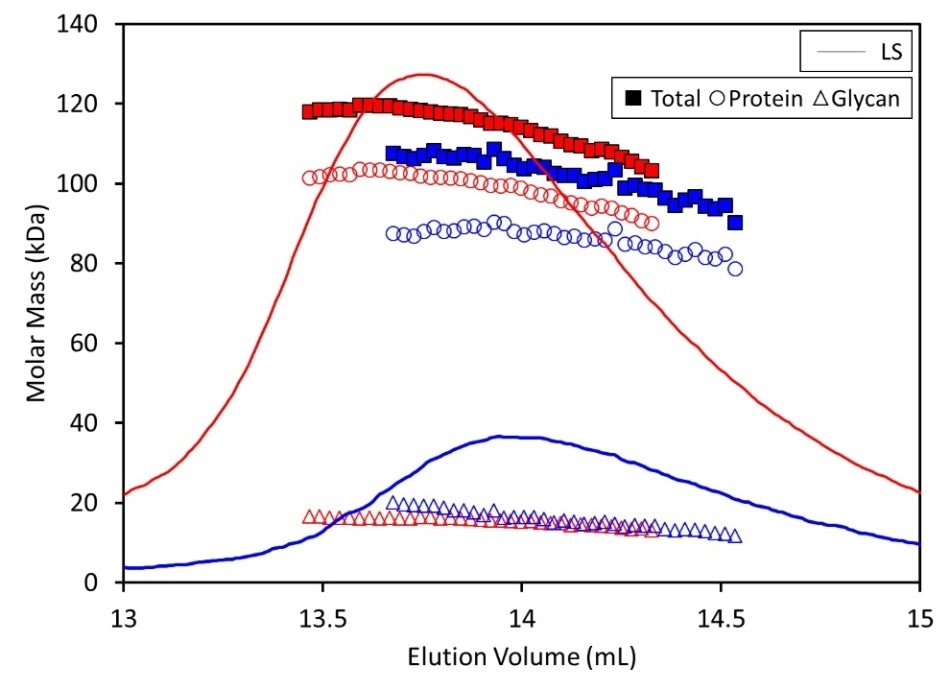
Figure 2. SEC-MALS data with Protein Conjugate Analysis of 400 µl (red) and 100 µl (blue) injections of vGP. When 400 µl of sample was run over the column, the MP of vGP was calculated as 118 kDa (82.5% protein content), corresponding to a dimer. When 100 µl of the same concentration was run over the column, the MP of vGP was calculated as 104 kDa (83% protein content), suggesting the dimer forms with fast kinetics
Measured by MALS, the molar increased as a function of injection volume or eluting concentration. This indicates an equilibrium association, as shown in Figure 2, with fast kinetics.
For this particular experiment, the apex molecular weight (MP) for an injection of 400 µL was 118 kDa at an eluting concentration of 199 µg/mL and for an injection of 100 µL was 104 kDa at an eluting concentration of 66 µg/mL (Figure 3). The predicted monomer mass of the vGP was 47 kDa.
Of this ~10 kDa, added as glycan mass, is a result of the 9 potential glycosylation sites. As a result, the molecular mass measured for the glycoprotein using SEC-MALS matches to a native dimer.
The increase in molecular mass as a result of concentration may indicate an equilibrium association of the dimers with species of higher order.
Figure 3. The weight-average molar mass of vGP increases as a function of concentration in CG-MALS experiments, suggesting equilibrium self-association, in agreement with SEC-MALS data
A concentration-dependent increase in molar mass of a similar kind was noticed in CG-MALS tests of vGP. A molar mass increase from 94 kDa to 106 kDa was observed in a one-species concentration gradient for vGP, which consists of 5 different concentration levels from 9.4 µg/mL to 47 µg/mL.
This indicates that the vGP is a native dimer in experimental conditions with a tiny amount of tetramer (dimers of dimers). However, as the contribution of the species was so inconsequential, the GP sample was tagged as a native, non-associating dimer rather than the term being used in the perfect fit model,
Equilibrium Association of IgG and vGP
In order to explore the potential interactions that take place in a solution of anti-vGP monoclonal antibody (IgG) and vGP, automated Calypso techniques calculated multiple protein compositions.
Light scattering and concentration measurements at 17 IgG and vGP concentration levels for hetero-association and at 5 vGP concentration levels for self-association were merged in the data.
The Mw derived from SEC-MALS (Figure 2) was in good agreement with the vGP, which was considered as a native dimer with a measured molar mass of 100 kDa. The formula weight mass of 144.84 kDa corresponded with the antibody’s molar mass, evaluated as 145 kDa.
At the time of the crossover gradient, the fusion of vGP to IgG was apparent in the quantified weight-average molar mass (Mw).
An increase of the weight-average molar mass (Mw) matching complex formation was observed. The increase in Mw was found to be more than twice the Mw for a mix of non-interacting proteins. This is indicated by the gray dotted lines in Figure 4.
Figure 4. Weight-average molar mass for each composition of the hetero-association gradient. The formation of IgG:vGP complexes results in an increase in measured molar mass. The best fit (red line) requires higher order association than simply (IgG)(GP) and (IgG)(GP)2, shown by the “1:n Only” curve (green dashed line). The molar concentration of GP refers to the dimer concentration.
The concentration and light scattering intensity data were explored to evaluate the stoichiometry and binding affinity for the interaction between IgG and vGP (Figure 5, left). An association model best describing the data includes the following:
- Two vGP-binding sites for each antibody molecule, where 1 or 2 vGP dimers can attach to each antibody with equal affinity
- A higher order complex consisting of two vGP dimers attached to two antibodies.
Most importantly, there was one association model, which introduced a term for two equal antibody-binding sites for each vGP dimer that did not correspond with the data. This indicates that a second IgG molecule may be stopped from binding because of a steric barrier, and the antibody epitope may be at or close to the dimeric interface.
A model that ignores the higher order complexes mentioned in #2 does not correspond with the data, as indicated by the green dashed line in Figure 4. This suggests that there might be a small amount of higher-order oligomers, (mostly a dimer of dimers) to which more than one antibody can bind.
The equilibrium association constants for the interactions between the vGP and the IgG derived from the best fits are listed below.
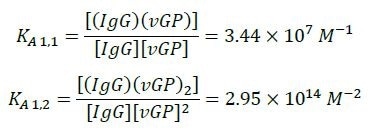
These constants match KD = 58 nM a single-site binding affinity. The (IgG)2(GP)2 interaction’s equilibrium association constant was measured to be KA 2,2 = 1.63 x 10²¹ M- 3. This value matches an average single-site affinity of KD = 85 nM.
The calculated KA and molecular weights were employed to evaluate the concentration level for each individual species in a solution at the time of crossover gradient (Figure 5, right). Both of the (IgG)2(vGP)2 and (IgG) (vGP) species reached their highest concentration when the total concentration of both IgG and vGP dimer were equal i.e. [vGP]total = [IgG]total = 209 nM.
Although both the species reached their peak at the same composition of vGP and IgG, the amount of (IgG)(GP) was over six times more than the amount of (IgG)2(GP)2 (Figure 5, right). The highest concentration of (IgG)(vGP)2 was reached when the [vGP]total = 2[IgG]total = 290 nM.
Figure 5. Best fit of CG-MALS data (left) and mole fraction of each species (right). Left: The CG-MALS hetero-association data was best fit to a model wherein each Fab of the IgG bound to the vGP dimer with equivalent affinity. The best fit ( ) to the measured )λlight scattering data (
.jpg) ) is made up of the sum of the contributions of the free monomer IgG, free vGP dimer, IgG bound to one or two vGP dimers (“1:n”), and a higher order complex of two IgG molecules bound to two vGP dimers. Right: The light scattering data are converted to molar concentration of each complex. The fraction of unbound IgG monomer and vGP dimer have been left off for clarity.
) is made up of the sum of the contributions of the free monomer IgG, free vGP dimer, IgG bound to one or two vGP dimers (“1:n”), and a higher order complex of two IgG molecules bound to two vGP dimers. Right: The light scattering data are converted to molar concentration of each complex. The fraction of unbound IgG monomer and vGP dimer have been left off for clarity.
Conclusion
Combining differential refractive index detection analysis and multi-angle light scattering with size-exclusion chromatography enable the researchers to evaluate, without any doubt, the protein component weight, glycan content for a recombinantly expressed viral glycoprotein, and the total molecular weight. This method also allowed them to demonstrate that the vGP forges higher order associations that separate with rapid kinetics.
Each and every species found in a solution of antibody and vGP was quantified using CG-MALS. As observed earlier in many occasions in IgG-antigen interactions, the researchers anticipated one IgG molecule to attach to two GP dimers with the same affinity.
They were surprised when the result was not what they expected. The binding of two IgG molecules, by one vGP dimer, did not take place simultaneously.
The researchers were able to gain a better understanding of the interaction between this antibody and its antigen in a more detailed manner than previously possible, using CG-MALS. In addition to providing important information related to the affinity of all types of interactions, the method has also provided information related to the antibody’s possible epitope.
This information is crucial for the development of antigens for vaccine production or developing post-exposure treatments.

This information has been sourced, reviewed and adapted from materials provided by Wyatt Technology.
For more information on this source, please visit Wyatt Technology.