Sponsored by AdmesyJan 20 2017
This article outlines how the Rhea spectrometer series can be used in many different ways to make transmission measurements of translucent materials and how it can be customized to take the best measurements possible.
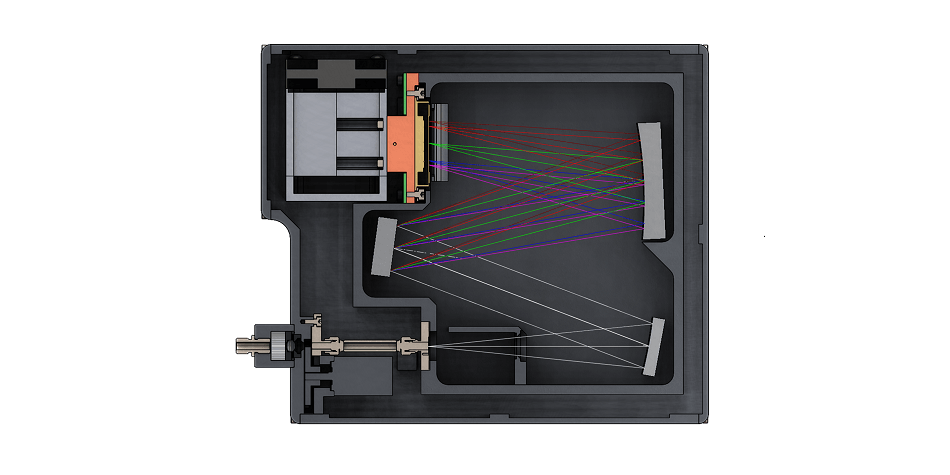
Image Credit: Admesy
As measuring translucent materials has endless applications, focus is given to the generic principle of transmission measurement. Measurements of foils, thin film, glass and even liquids in cuvettes and fluorescence measurements are some examples of application areas.
This article briefly discusses the procedures involved and demonstrates several potential test setups in terms of optical configurations for measuring transmission. It then shows how spectral measurement engine and light source can be adjusted to suit the users’ specific transmission measurement application.
Transmission Measurements
Measurement Procedure and Setup
Two steps are generally involved in transmission measurement procedures - collecting a baseline by measuring the reference standard light source without the material or object, and measuring with the material or object.
Any deviation between these measurements will define the spectral transmission characteristics of the given object. The generic aspects of transmission measurements are discussed in this article.
In transmission measurements, transmittance of an object has to be measured with a detector and a reference standard light source, and this reference light source can either be a halogen or LED source.
Various light sources may be used in order to match the spectral properties of the object to be measured: these light sources should be able to emit the entire preferred wavelength range of the object being tested. At wavelengths where light is not emitted, then light cannot be transmitted, which means it is not possible to derive the properties from the measured data.
For all translucent objects, some part of the light is reflected, some is absorbed, and some is transmitted. The object’s characteristics define the deviation between these three variables at various wavelengths.
Due to energy conservation, it can be stated that the total amount of light emitted by a light source directed towards an object equals the sum of absorption (α), transmission (τ) and reflection (ρ) of a given object (Equation 1).
Consider the fact that the detector can only measure the object’s transmission. The setups and procedures outlined in this article cannot be used to measure the absorption and reflection, and these can only be derived as a sum from the collected data using equation 1.
α + τ + ρ = 1 Equation 1
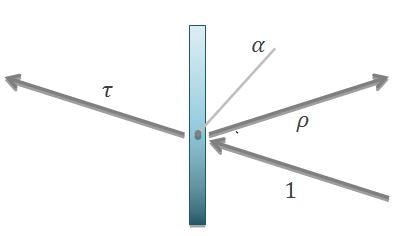
Figure 1. Incoming light (1) is split into absorption, transmission and reflection. Image Credit: Admesy
Sample Properties
Applying translucent objects may lead to particular transmission properties. A material may transmit light directly through the object, or it may have a diffuse light distribution on the opposite side or anything in between. The difference between diffuse and non-diffuse materials is shown in Figures 2 and 3.
When considering the right measurement geometry, these properties in the response of the material to be measured become important. Options can vary from using cosine correctors and integrating spheres, to using lenses for emitting and receiving light, and also combinations of these optics.
An integrating sphere is recommended for highly diffuse translucent objects. The light output may be relatively low if a cosine corrector is used for measuring highly diffuse translucent materials. Based on the whole setting, the signal to noise ratio may not be optimal and will negatively affect the measurement results.
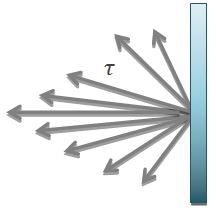
Figure 2. Example of diffuse transmissive response: transmitted light rays are distributed over a large angle. An integrating sphere may be desirable to capture all the transmitted light. Image Credit: Admesy
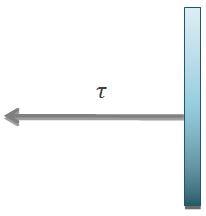
Figure 3. Example of non-diffuse transmissive response: transmitted light rays are not diffusely spread. For such applications, a cosine corrector based system may be useful. Image Credit: Admesy
Geometry 1: Integrating Sphere / Lens
The following procedure demonstrates a setup using a spectrometer linked to an integrating sphere and Steropes LED light source with collimating lens. Based on the application, the light source can be joined to the integrating sphere providing a diffuse light.
The lens is then connected to the spectrometer to measure the light. An alternative option is to connect the light source to the lens and measure the transmission of light via the integrating sphere connected to the spectrometer. All transmission measurements described in this article depends on the same process, only using different optics.
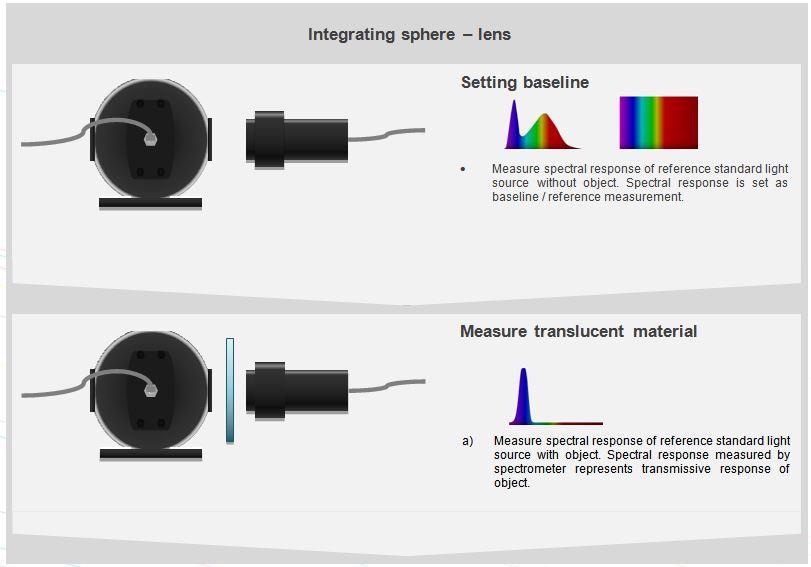
First option: Light source –integrating sphere – sample – collimating lens – spectrometer. Second option: spectrometer – integrating sphere – sample – collimating lens – light source. Image Credit: Admesy
Geometry 2: Cosine Corrector / Lens
Transmission measurements can also be made using the combination of a cosine corrector paired to the light source or spectrometer and on the other side a (collimating) lens paired to the other device. The transmitted light will be collimated if a collimating lens is linked to the light source.
The cosine corrector should be connected to the spectrometer and the lens should be connected to the light source or vice versa, depending on the properties of the material to be measured. After that, the measurement procedure remains the same: set a baseline and carry out a measurement afterwards.
To obtain optimal measurement results, the distance between the object and light source and the cosine corrector and object should be as small as possible. It must be noted that this optical configuration is more cost effective compared to integrating sphere setups, although it also needs more precision with regard to alignment.
If the lens and cosine corrector are not properly aligned, the measured data may be negatively affected by measurement deviations.
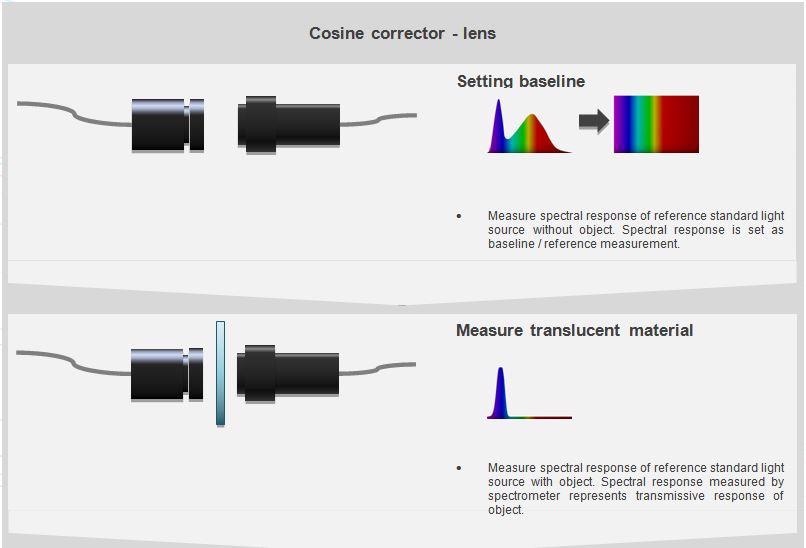
First option: : Light source – cosine corrector – sample – collimating lens – spectrometer. Second option: spectrometer – cosine corrector – sample – collimating lens – light source. Image Credit: Admesy
Choosing and Customizing the Right Measurement Equipment
Light Source
Transmission measurements can be performed on different types of translucent objects or materials. Following the right procedure as well as the combination of equipment used will define the results of transmission measurements.
To achieve usable data, both a detector (spectrometer) and light source that match the spectral region of interest of the material to be measured should be used. For instance, if a measurement application requires a complete spectral analysis in the VIS (380 - 780 nm) range, both the spectrometer and the light source should be able to cover this wavelength range with excellent signal to noise ratio.
This means that the light source should emit enough at a certain wavelength. In order to support a variety of measurement applications, Admesy provides a host of stabilized light sources from custom colored and white LED light sources, as well as halogen with optional blue enhancement filters that provide optimized response across the entire wavelength range.
Shown below are some examples of spectral power distributions of Admesy light sources. As can be observed, all of the light sources exhibit a completely different spectral distribution, indicating different peaks in wavelength.
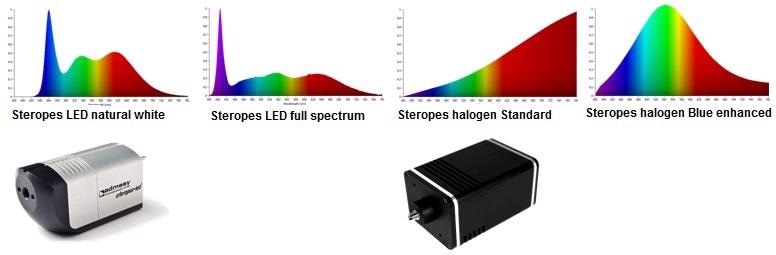
Image Credit: Admesy
Spectrometer
Image Credit: Admesy
Selecting the correct spectrometer configuration is vital to obtain usable transmission measurement data. The spectrometer should be sensitive enough at the given wavelength range of interest of a sample. In addition to the spectral range of interest, the amount of detail required in measurement data is also equally important.
If a measurement application requires high precision analysis of a small spectral range, then the optical resolution may have to be higher than for a broadband measurement. In order to cover these key aspects, Admesy has designed the Rhea spectrometer series - a fully customizable spectrometer that covers the 200 - 1100 nm range. The following sections describe the tunable elements of the Rhea series spectrometer.
Detector
The Rhea spectrometer uses Hamamatsu’s cooled CCD detectors. Currently, the spectrometer supports detectors for the 200 - 1100 nm range. The following graph shows the quantum efficiency of this detector. In the future, the Rhea series spectrometer will be integrated with more detector options.
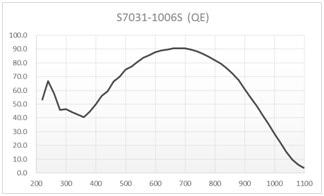
Image Credit: Admesy
Slit Size
The amount of light entering the optical bench is defined by the size of the slit, which influences the FWHM - the smaller the slit size, the lower the FWHM, the higher the resolution. Different sizes of slits can be fitted into all Rhea configurations. The following table provides an overview of approximate FWHM with a given slit size and groove density.
| FWHM [nm] S7031-1006 detector (1024 pixels) |
| Grating G/mm |
100 µm |
50 µm |
25 µm |
10 µm |
| 200 |
3.7 |
2.7 |
2.4 |
2.3 |
| 300 |
2.6 |
1.8 |
1.6 |
1.5 |
| 500 |
1.5 |
1.1 |
0.95 |
0.85 |
| 600 |
1.3 |
0.9 |
0.8 |
0.7 |
| 900 |
0.90-0.65 |
0.60-0.45 |
0.55-0.40 |
0.45-0.36 |
| 1200 |
0.68-0.40 |
0.45-0.27 |
0.40-0.24 |
0.32-0.19 |
| 1600 |
0.45-0.14 |
0.30-0.10 |
0.26-0.08 |
0.21-0.06 |
| 1800 |
0.41-0.12 |
0.27-0.08 |
0.24-0.07 |
0.19-0.05 |
Gratings
The grating disperses the light into individual wavelengths - the amount of dispersion is determined by the number of grooves, which is expressed in grooves per millimeter. The optimal efficiency at a specific wavelength is determined by the blaze wavelength.
200 grooves system response
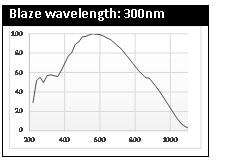
Image Credit: Admesy
300 grooves system response
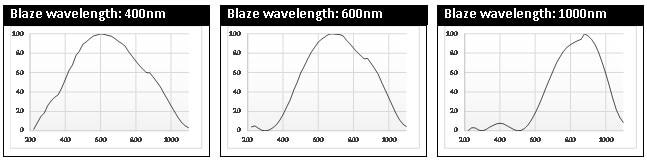
Image Credit: Admesy
500 grooves system response
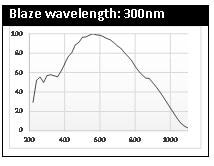
Image Credit: Admesy
600 grooves system response
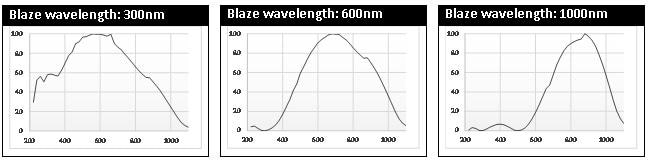
Image Credit: Admesy
900 grooves system response
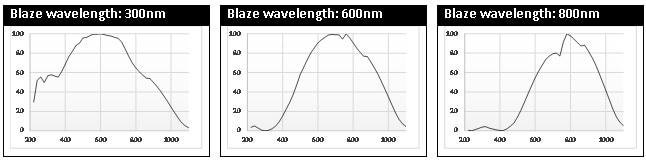
Image Credit: Admesy
1200 grooves system response
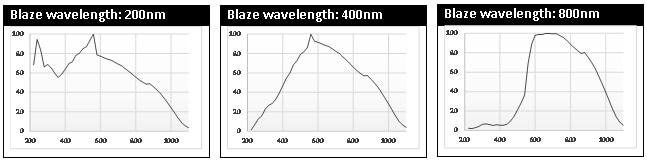
Image Credit: Admesy
1600 grooves system response
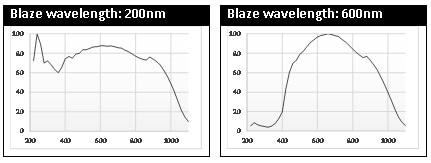
Image Credit: Admesy
1800 grooves system response
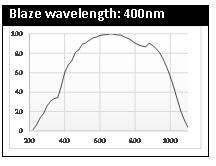
Image Credit: Admesy
Dispersion Range
If the number of grooves is higher, then the dispersion will be wider. However, this also restricts the range of wavelengths that can be resolved, because the detector has a fixed width. Low groove gratings can be used for a broad wavelength range, and high grooves gratings can be used for a complete analysis of a small wavelength range. This range is called the dispersion range. The number of grooves also affects the FWHM.
Filter Wheel
The Rhea spectrometer features a filter wheel with 4 ND filters (OD1, OD2, OD3 and OD4), which enable a large dynamic range that allows measurement of optical densities above OD 4. On the filter wheel, the fifth and sixth positions can fully open and close. As each ND filter is fully calibrated, spectral difference is not visible between ND filter wheel positions.
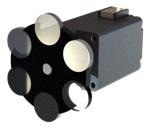
Image Credit: Admesy
Start and Stop Wavelength
Start and stop wavelength depend on the alignment and grating choice. For instance, a grating with a 200 nm dispersion range can be used from 300 nm to 500 nm, and also from 400 nm to 600 nm. The start and stop wavelength can be determined to fit specific measurement applications, based on the transmission measurement region of interest.
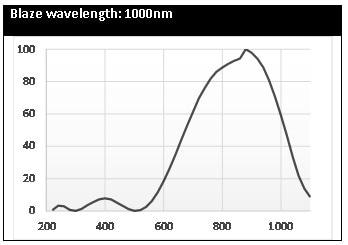
Image Credit: Admesy
The grating’s response graph is illustrated above with a 1000 nm blaze wavelength and a groove density of 300 grooves per millimeter. The response graph reveals its highest sensitivity in the 600 - 1100 nm range.
This Rhea configuration would be ideal for making transmission measurements within this spectral range. One potential application may be measurements of NIR blocking filters to establish the optical density beyond the visual spectrum. With an increasing number of available gratings, the number of configurations will become endless.

This information has been sourced, reviewed and adapted from materials provided by Admesy.
For more information on this source, please visit Admesy.