The use of atmospheric plasmas is growing in interest due to their benefit in processing materials, mainly organic, which are unsuitable for high vacuum. Such discharges are generally studied by optical emission spectroscopy but, to learn the surface characteristics of the treated material, it is essential to identify the identity and energy of the impinging species.
Atmospheric discharges from a variety of gas mixtures have been examined using a Hiden EQP mass/energy analyzer. The discharges were produced by an atmospheric plasma source that is driven by a radio frequency and were sampled using a multi-stage differentially pumped molecular beam inlet system. Outcomes for gas mixtures consisting of different percentages of N2, O2, N2O, and CO2 in Helium are compared.
Energy distributions of the ionic species are presented as a function of the discharge power and distance between the entrance to the analyzer and the plasma source.
Furthermore, the pathways for generating radical species in the numerous mixtures were established by appearance potential methods and electron attachment.
Experiment
(i) Discharge
The discharge was produced by a radio frequency driven atmospheric plasma source, based upon the design of Stoffels et al [1]. This authentic design was modified to incorporate a second, concentric gas inlet to study mixtures of gases. The inner gas inlet carries helium to the plasma volume and the outer gas inlet delivers different percentages of the gas to be studied (oxygen, nitrous oxide, nitrogen, and carbon dioxide). The low power discharge, approximately 7 W, was generated between the entrance of the Molecular Beam Mass Spectrometer (MBMS) analyzer and the plasma source, as depicted in Figure 1.
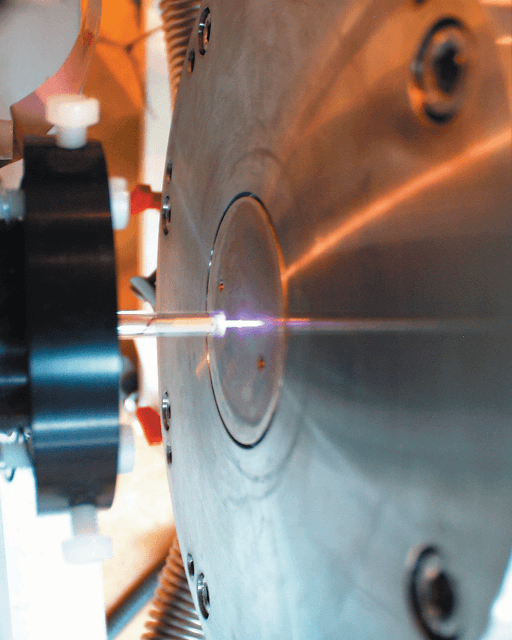
Figure 1. Atmospheric plasma produced between the RF electrode, or needle, and the sampling orifice of the Hiden Molecular Beam Mass Spectrometer.
(ii) Diagnostics
A triple stage differentially pumped molecular beam inlet system was used to sample the species developed in the atmospheric discharge. Subsequently, the species were detected with the Hiden EQP mass/energy analyzer. Figure 2 shows a schematic of the arrangement. The EQP mass/energy analyzer is accommodated in a vacuum chamber, which, in turn, is equipped with additional two intermediate expansion chambers between it and the plasma. Each of these three stages, or chambers, are separated by aligned skimmer cones and continuously pumped by separate turbo molecular pump sets. A molecular beam is formed and plasma species are detected and sampled without undergoing further reactions due to the free expansion from atmospheric pressure to the lower pressure stages.
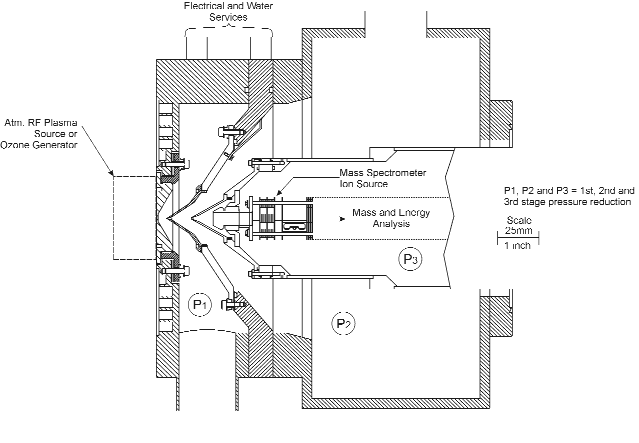
Figure 2. Schematic of the Hiden Modulated Beam Mass Spectrometer System. The three cones are fitted with apertures of 0.2 mm at the first stage, 0.3 mm at the second stage and 1.0 mm at the opening of the EQP mass/energy analyzer.
Ions
Figure 3 depicts a representative positive ion spectrum from a He (75%)/O2 (25%) discharge. The discharge was generated at low power (5 W) and at a distance of 4 mm from the MBMS sampling orifice.
The addition of oxygen generated a high percentage of dissociated O+ ions. Other species noted included NO+, HeH+, as well as H3O+ produced from atmospheric water vapor.
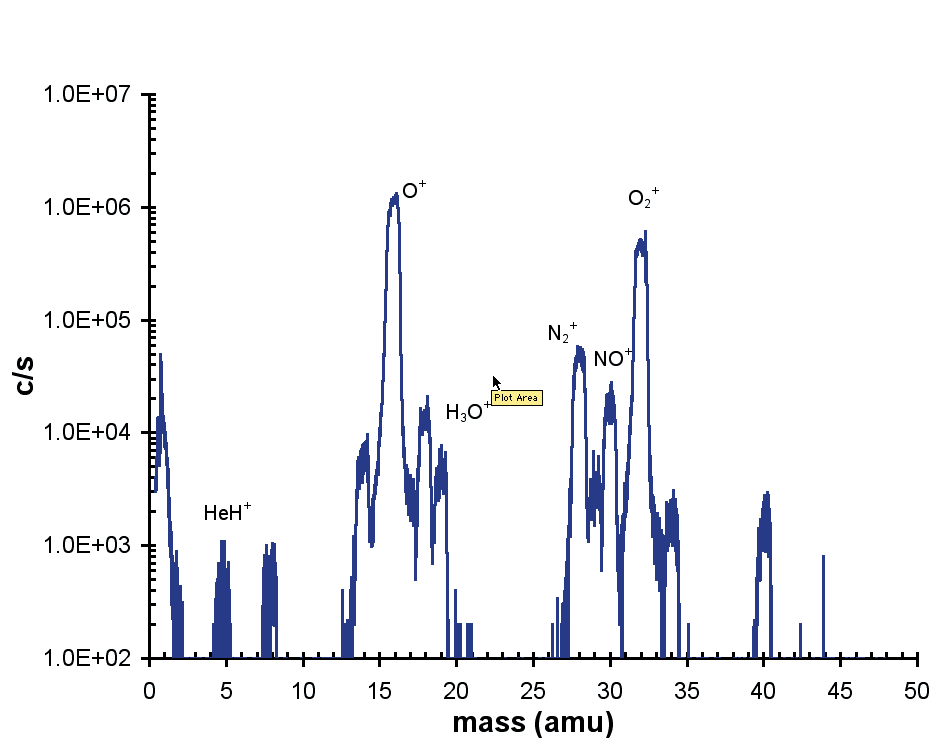
Figure 3. Positive ion mass spectrum.
The effect upon the positive ion energy distribution of modifying the distance between the grounded sampling orifice plate and the discharge electrode is represented in Figure 4. At 7 W input power, the discharge conditions were He(75%)/N2 (25%).
The distributions of ion energy are similar where the peak in the distribution of the energy increases moderately as the distance is lowered. The optimum distance was found to be 4 mm. At distances closer than this, the discharge became unstable. A similar result is noted for different percentage gas mixtures.
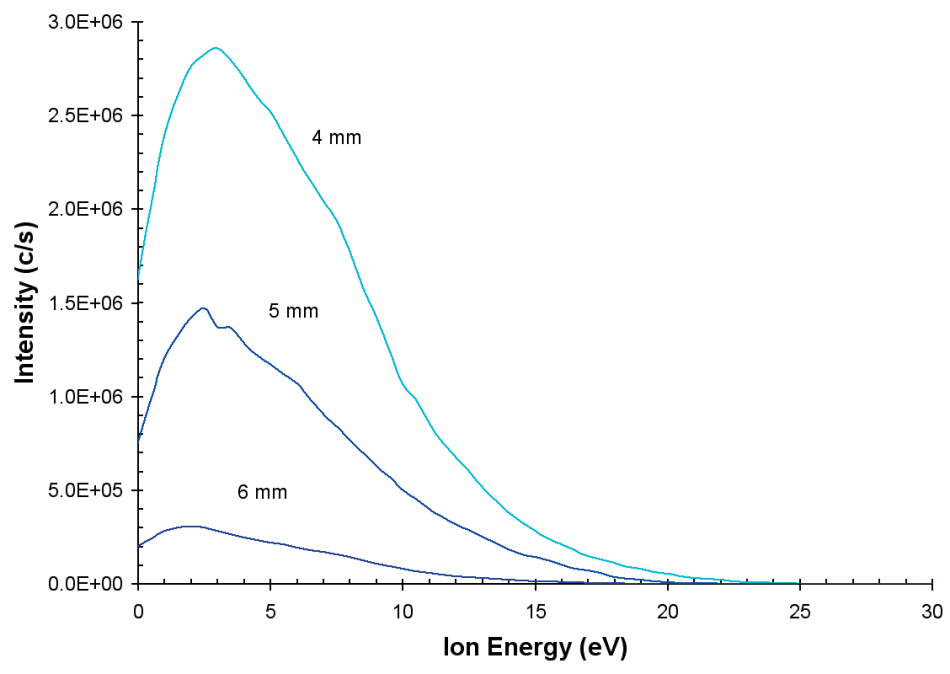
Figure 4. Ion energy distributions for N+ from the He/N2 plasma as a work of distance from the sampling orifice.
The ion energy distribution (O+ ions) was also calculated as a function of discharge power as depicted in Figure 4. At a distance of 4 mm, the discharge conditions were He(75%)/O2(25%).
As the applied power is increased the plasma potential, which is around 1-2 V at 3 W, increases and more energetic ions are observed with the tail of the distribution extending to almost 50 eV at 10 W.
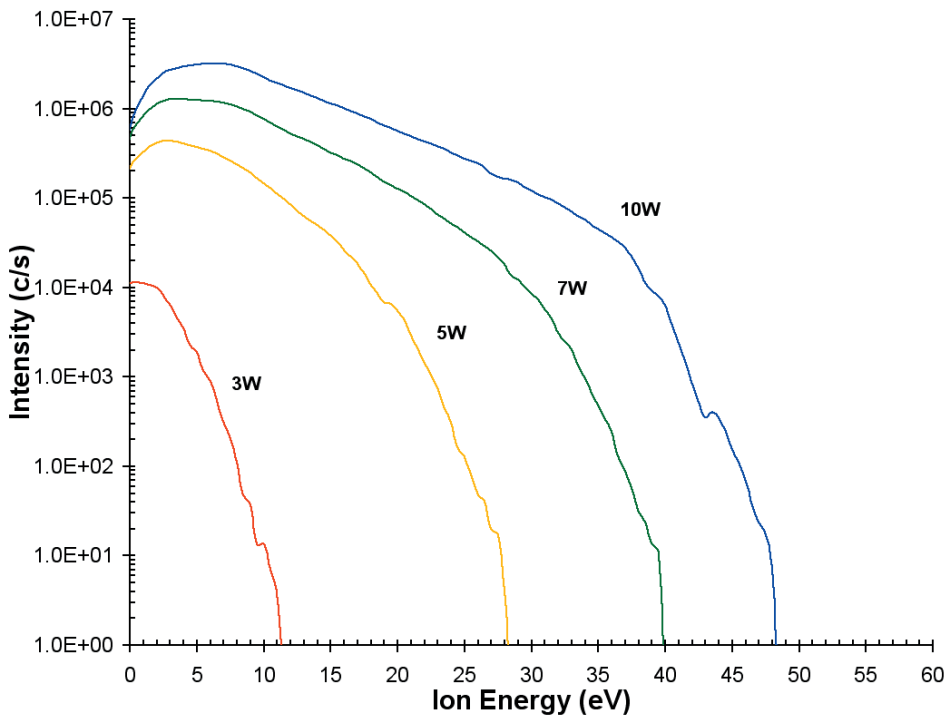
Figure 5. Ion energy distributions for O+ from the He/O2 plasma as a function of discharge power.
Neutrals
By utilizing the ion optics and internal ionizer of the EQP instrument, the charged particles can be rejected and neutral plasma particles can be studied. The spectrum is a convolution of the neutrals that are sampled from the plasma and the background neutrals that are ionized in the internal ionization source of the EQP.
Figure 6 depicts the mass spectra for a He/O2 discharge when the plasma is off and when it is on. The difference in these spectra can be inferred to provide information on the sampled neutrals.
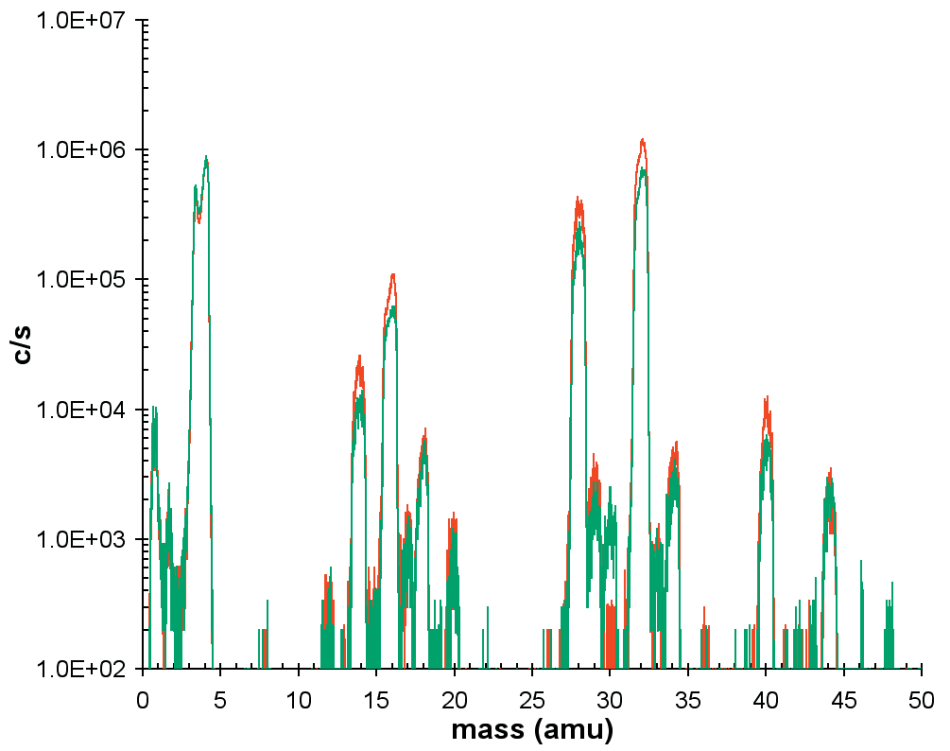
Figure 6. Neutral mass spectra for plasma on (red trace) and plasma off or background (green trace).
Appearance potential measurements are a well-established technique for measuring the radical component of a plasma. Figure 7 displays the appearance potential scans for atomic oxygen for both plasma on and plasma off conditions.
The O+ signal is partly due to direct ionization of the O radicals;
O + e → O+ + 2e (Ei = 14.8 eV)
and partly due to dissociative ionization of the O2 molecules;
O2 + e → O+ + O + 2e (Ei = 20.3 eV).
The background O radicals are produced by the dissociative ionization of the O2 molecules on the ionizer filaments with the plasma off.
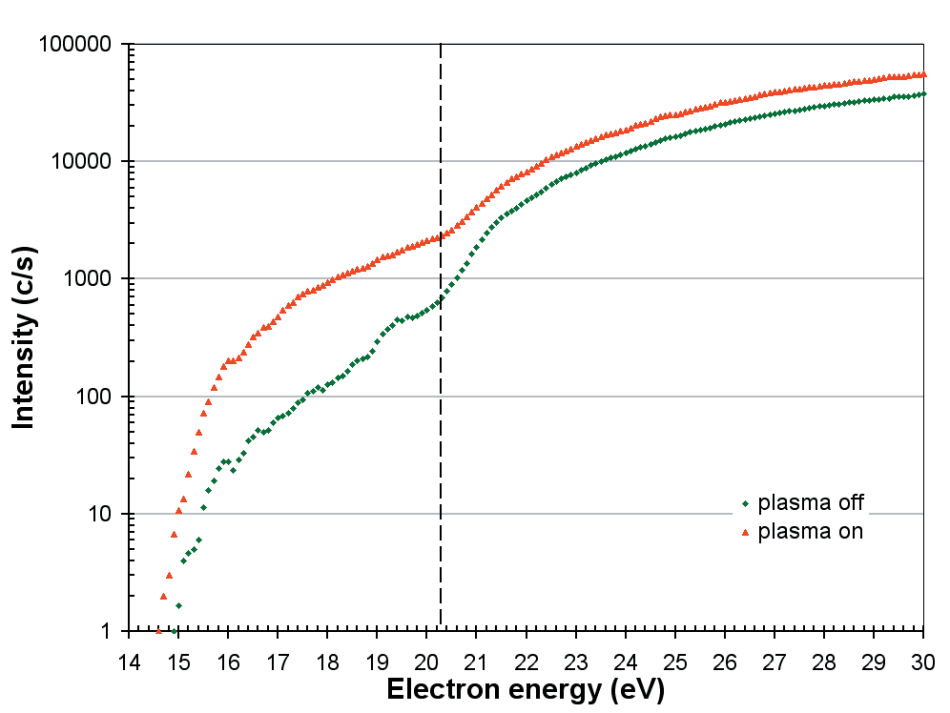
Figure 7. Appearance potential scans for O with the plasma on and off. The threshold for the dissociative ionization of O2 is 20.3 eV.
The equivalent appearance potential scans for N, from a He/N2 mixture, are displayed in Figure 8 and correspond to the processes;
N + e → N+ + 2e (Ei = 16.5 eV)
and dissociative ionization of N2;
N2 + e → N+ + N + 2e (Ei = 25.2 eV)
Similar measurements have been recorded for other radicals from industrially relevant gas mixtures such as NOx from He/N2O and the quantification of these results will be the subject of additional work.
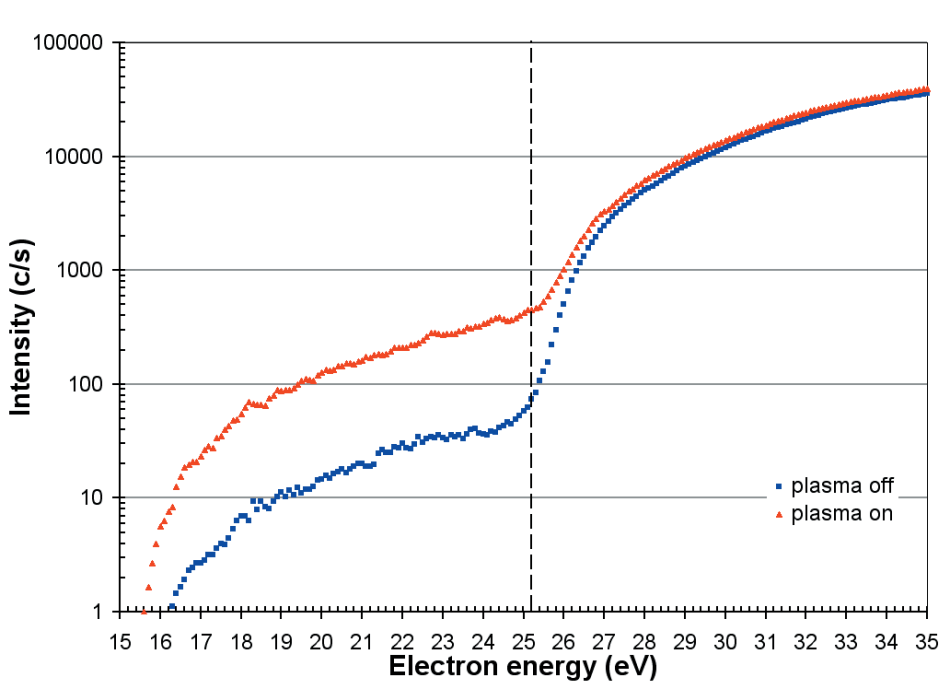
Figure 8. Appearance potential scans for N with the plasma on and off. The threshold for the dissociative ionization from N2 is 25.2eV.
Ozone
Ozone generated by atmospheric plasma sources is largely used as a sterilizing agent. The Hiden MBMS system has been pressed into action to produce initial measurements of the ozone that has been generated from one such commercial source from Enaly Trade Co. Ltd.
O+, O2+, and O3+ ions were noted. The appearance potential of O3+ (at around 10 ppm) was computed at 12.2 eV, which is shown in Figure 9. This is in agreement with the values reported by Radwan et al. [2].
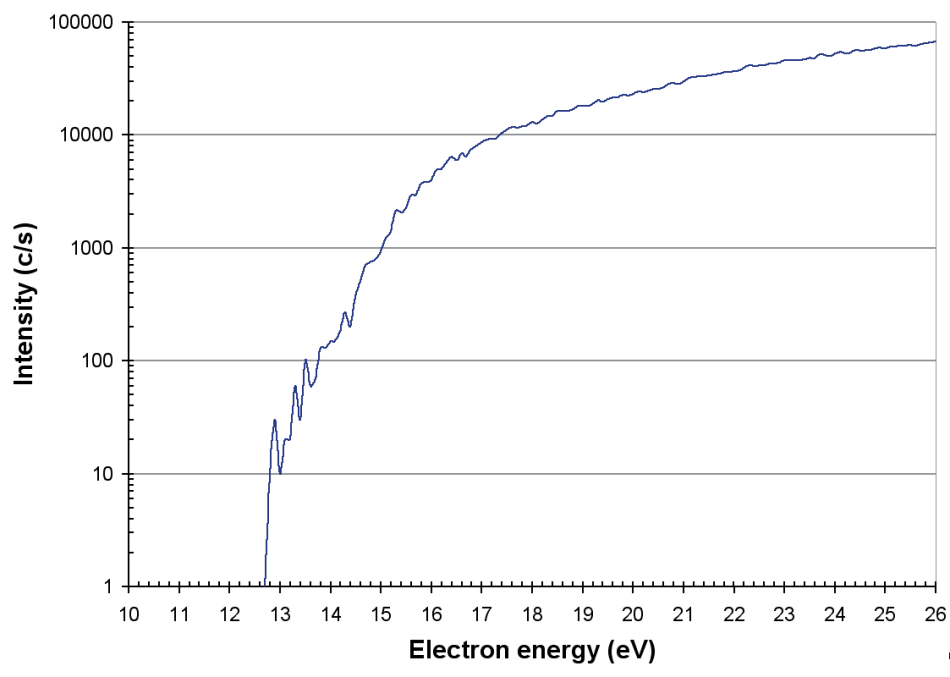
Figure 9. Appearance potential of O3+ produced in a commercial ozone generator.
The internal ionization source of the EQP mass/energy analyzer may also be set to function at low electron energies to review electron attachment processes. The electron attachment scans for the production of O2– are represented in Figure 10 when the ozone generator is off and on. For both cases, there is a large attachment peak in between 8–10 eV which is from direct attachment to O2.
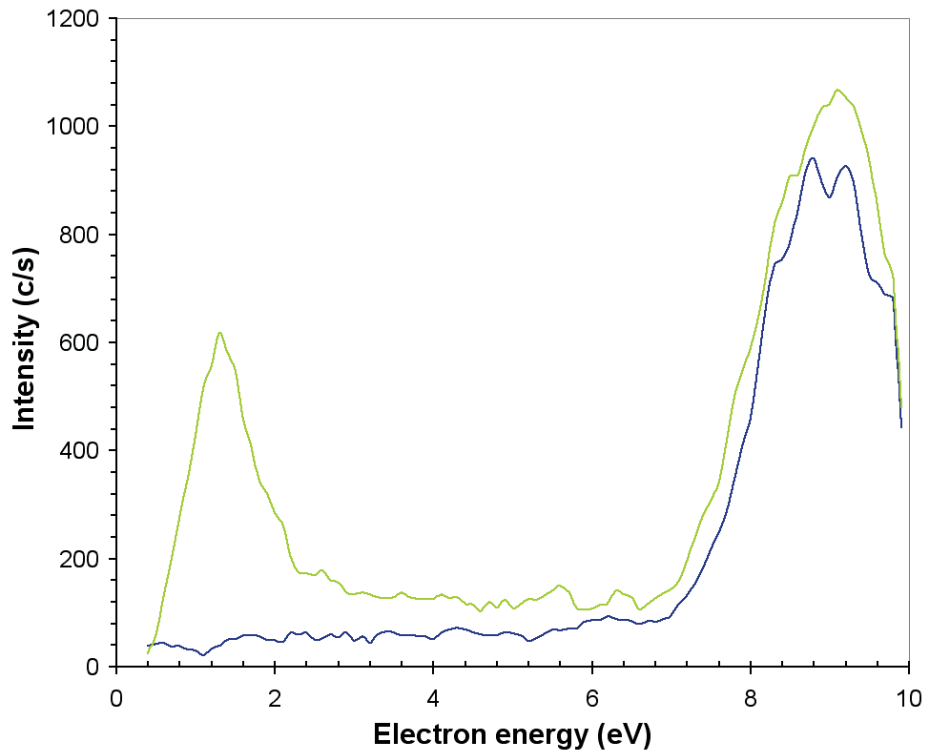
Figure 10. O2– produced by electron attachment in the EQP ion source when the ozone generator is on (green line) and when it is off (blue line).
When the ozone generator is switched on, a second and smaller attachment peak is seen around 1.5 eV which is due to the dissociative attachment process;
O3 + e → O2– + O (Ea = 1.5 eV),
in agreement with previously recorded results, Curran [3].
Conclusions
The EQP mass/energy analyzer and the Hiden Molecular Beam Mass Spectrometer System have been used to review several atmospheric plasma sources relevant to materials processing.
Positive ions have been detected and their energy distributions have been computed. Numerous radicals have been detected by electron attachment mass spectrometry and appearance potential. Further work will focus on measuring the preliminary data given in this article.
References
- E Stoffels, A J Flikweert, V W Stoffels and G M W Kroesen, Plasma Sources Sci. Technol, 11 (2002) pp 383-388
- T N Radwan and D W Turner, J. Chem. Soc. (A), (1966) pp 85 – 86
- R K Curran, J. Chem. Phys., V(35) 5 (1961) pp 1849-1851

This information has been sourced, reviewed and adapted from materials provided by Hiden Analytical.
For more information on this source, please visit Hiden Analytical.