The primary use of urea is as a nitrogen-release fertilizer, with over 90% of urea production utilized in agriculture.[1] It is also used to separate complex mixtures and for purification purposes[3] due to its ability to form complexes with fatty acids.[2]
This article will talk about the quantification of the concentration of urea in ethanol via Raman Spectroscopy and how this technique can be used to determine the percentage of urea in a solid inclusion compound with stearic acid.[4]
Experimental
Chemicals: Urea (Aldrich, >99%); Stearic acid (SA) (Aldrich, >95%); Ethanol (Soria)
Instrument: i-Raman® Plus BWS465-785
Stock solutions of urea (0.0420 gr/gr Ethanol) and SA (0.04126 gr/gr Ethanol) were prepared. Standard solutions were prepared by mixing these stock solutions in different proportions in order to obtain urea concentrations between 0 and 0.042 gr/gr ethanol and keeping the total mass concentration (urea + SA) approximately constant.
Raman spectra of 0.5 mL of each solution in aluminum containers were measured employing a 785 nm laser (power: 30 %, ~ 90 mW) and 5000 msec of acquisition time (20 repetitions). No effects of heating or evaporation were observed. Spectra of the standard solutions that were background corrected employing the BWSpec® software are shown in Figure 1.
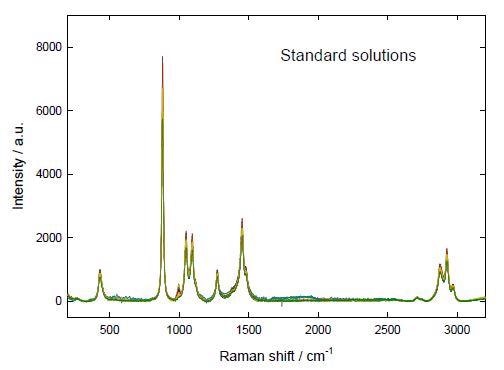
Figure 1. Dark-subtracted baseline-corrected Raman spectra of the standard solutions of urea and SA in ethanol.
Results
The Raman spectra were normalized by employing the intensity of the ethanol band at 1049-1050 cm-1. Normalized spectra in Figure 2 show that the only significant change due to the increment in relative urea concentration occurs at the band at 996-997 cm-1, which is attributed to urea. This band corresponds to the symmetric C-N stretching[5] that is experimentally and theoretically reported at about 1010 cm-1 for the solid urea,[6] but shifts to lower wavenumbers in solution.[5,7]
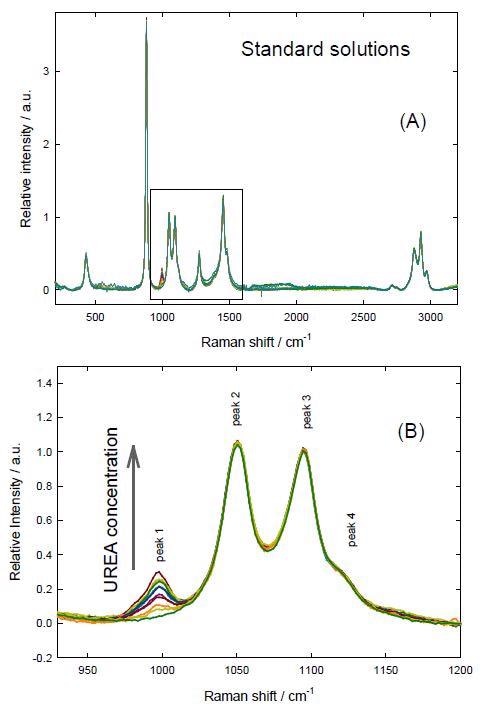
Figure 2. Normalized spectra of the standard solutions of urea + SA in ethanol. (A) Complete spectra (B) Analyzed region.
In order to quantify the spectra, they were deconvoluted by fitting the experimental results in the region 950-1200 cm-1 by 4 Lorentzian functions. Figure 3 shows the results of curve fitting for some of the standard solutions.
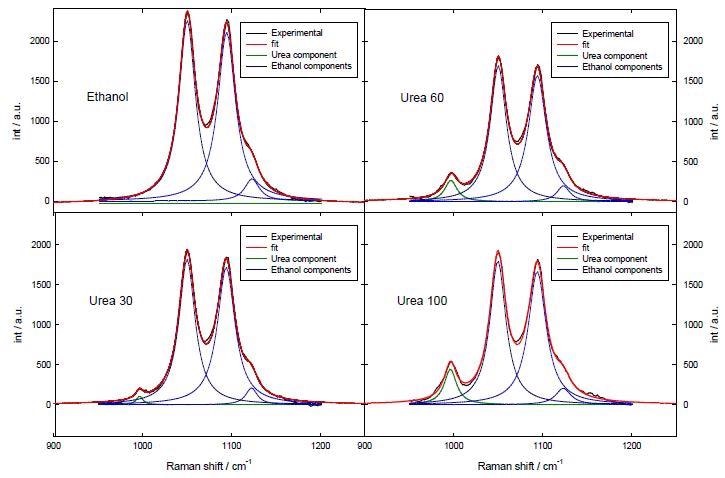
Figure 3. Fitting of the Raman spectra in the region 950-1200 cm-1. Urea 30, Urea 60 and Urea 100 mean solutions 0.0123, 0.0248 and 0.0413 gr urea/gr ethanol respectively.
The ratio of the intensities of the fitted peaks assigned to urea at 996 cm-1 (peak 1, a1) and ethanol at 1049 cm-1 (peak 2, a2) was employed as the analytical parameters. The dependence of this ratio on the urea concentration of the samples is presented in Figure 4. This parameter has potential for use in urea quantification as the calibration curve plotted shows a good linear behavior.
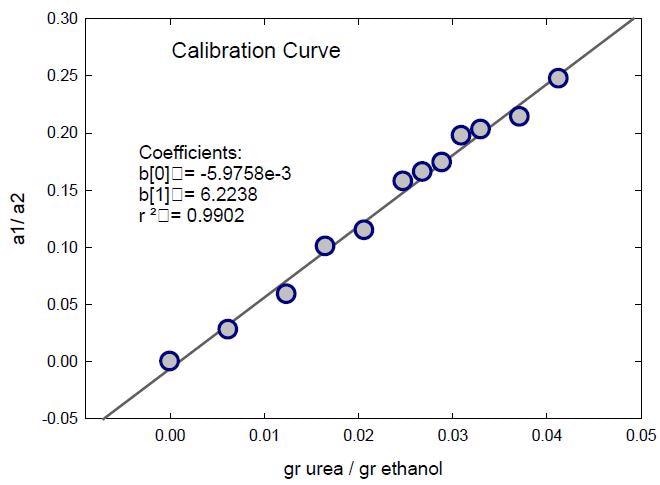
Figure 4. Calibration curve for the urea quantification in ethanol. Ratio of the intensities of the fitted bands of urea (a1) and ethanol (a2) as a function of the urea content of the standard solutions.
In order to determine the urea content of real samples containing both urea and SA, the solid sample was dissolved in ethanol (0.04299 gr/gr ethanol) and Raman spectra were recorded in the same conditions. As before, the peaks at 996 and 1049 cm-1 (Figure 5) were fitted, and the values of the ratio a1/a2 allowed the urea concentration of the solution was determined to be 0.03274 gr urea/gr ethanol.
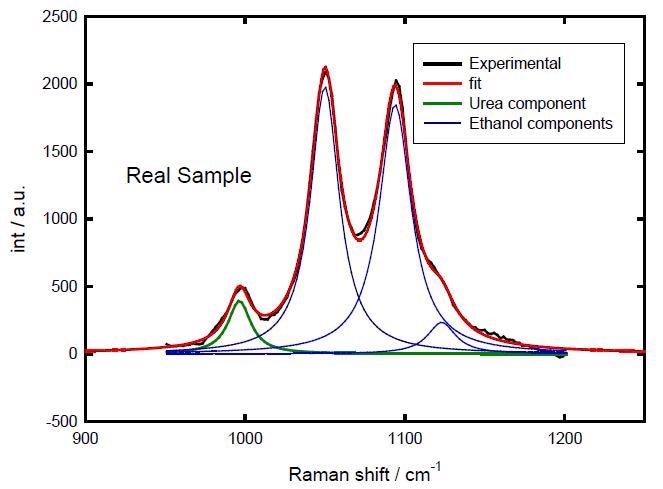
Figure 5. Fitting of the sample spectrum.
Therefore, the urea content of the sample could be reported as 76 % w/w. This is consistent with other reported values for the inclusion compounds formed by stearic acid and urea (ca. 75 %).[2,4]
Conclusion
A simple method for quantification of urea concentration in ethanolic solutions by Raman spectroscopy is presented in this article. The calibration curve presents good linearity in the concentration range analyzed (up to 0.042 gr urea / gr ethanol).
The presence of stearic acid in the samples does not modify appreciably the Raman spectra (at least up to 0.042 gr / gr ethanol), so this method allows the quantification of urea in solid binary samples containing both urea and stearic acid.
References and Further Reading
- J. H. Meessen, H. Petersen, in Ullmann’s Encycl. Ind. Chem., Wiley-VCH Verlag GmbH & Co. KGaA, 2000.
- H. Schlenk, R. T. Holman, J. Am. Chem. Soc. 1950, 72, 5001–5004.
- D. G. Hayes, Y. C. Bengtsson, J. M. Van Alstine, F. Setterwall, J. Am. Oil Chem. Soc. 1998, 75, 1403–1409.
- A. Strocchi, G. Bonaga, Chem. Phys. Lipids 1975, 15, 87–94.
- R. Keuleers, H. O. Desseyn, B. Rousseau, C. Van Alsenoy, J. Phys. Chem. A 1999, 103, 4621.
- B. Rousseau, C. Van Alsenoy, R. Keuleers, H. O. Desseyn, J. Phys. Chem. A 1998, 102, 6540–6548.
- D. Gangopadhyay, S. K. Singh, P. Sharma, H. Mishra, V. K. Unnikrishnan, B. Singh, R. K. Singh, Spectrochim. Acta Part A Mol. Biomol. Spectrosc. 2016, 154, 200–206.

This information has been sourced, reviewed and adapted from materials provided by B&W Tek.
For more information on this source, please visit B&W Tek.