Sponsored by AdmesyAug 10 2018
Colorimetry is the science used to determine color in perspective of the human eye.
Image Credit: Delpixel/Shutterstock.com
The science of measuring color and color appearance is vital: The perception of color is a subjective process where the brain responds to stimuli produced when incoming light reacts with the several different types of cone cells in the eye.
The way humans perceive color is a subjective psychological phenomenon. It is based upon the connection between the wavelengths detected by the rod and cone cells and the subsequent processing of those signals by neural pathways. Put simply, the same illuminated object can be seen in different ways by different people.
Understanding Human Tristimulus Vision
There are two different cell types that contribute to human vision - cone cells operate at high and medium levels of brightness (daytime), and rod cells which operate at low brightness, for example at night.
Human tri-stimulus vision is based on three different cone cell types, of which each covers a different wavelength range. Each type of cone cell has peaks of spectral sensitivity in short (420 nm – 440 nm, blue)(S), middle (530 nm – 540 nm, green)(M), and long (560 nm – 580 nm, red)(L) wavelengths. Each type of cone cell responds to a specific range (or roughly said: color), and the combination of how much each cell type is stimulated, results in the experience of a specific color.
Under low-luminance conditions, rods take over human vision as cone cells are not sensitive enough to perform under such conditions. Rods are way more sensitive but only come in one type with its own typical spectral response. As it only relies on a specific wavelength range that is not combined with other ranges, human night vision is monochromatic. In other words: the human eye is not able to discriminate colors under low luminance conditions.
The CIE 1931 Color Space
Although the actual average human response of S, M and L are known, colorimetry relies on different spectral sensitivity curves. In 1931 the International Commission on Illumination (CIE, Commission International de l'Éclairage – CIE in French) developed the CIE 1931 color space as a response to the need for an objective method of describing color (which relates to the human perception of color).
The CIE model works by describing any apparent color of any given spot as a 3-dimensional value of red green and blue. These experiments have been conducted and resulted in the XYZ responses which are translated into a two-dimensional color chart. Any visible color to the human eye can be plotted in this color space.
The CIE 1931 color space was the first time that the distributions of wavelengths in the visible portion of the electromagnetic spectrum, and the colors perceived by the human eye had been directly linked. However, this and other such models, are a mathematical simplification of human color vision based on a relatively small (assumed to be representative) population.
While this allows researchers to define and accurately produce colors in a conventional situation, these models cannot hope to encompass the vast amount of colors and hues that the human eye can perceive. They are simply a tool for matching colors in various applications such as display measurements.
Defining a Standard Human Observer
Although human color perception is fundamentally subjective, it is possible to work with s standard human observer to make objective measurements of the color of an object. There are a number of standard human observers defined in colorimetry, including the 2° field of vision model (like the 1931 model), which uses the high concentration of cone cells in the fovea and the 10° field model, which broadens the visual range.
The CIE 1931 model 2° uses chromaticity as a function to describe the two important parameters hue and purity. A complete description of the color of a spot on of an RGB emitting source can be provided by measuring the luminance and chromaticity.
This description can then be linked to the color in terms of the brightness, hue, and purity, and if plotted as chromaticity coordinates on a chromaticity diagram, the triangle formed from the points encloses all the colors that can be reproduced by the light source. This is known as the color gamut of the source and applies in fact to any multi-colored tunable light source like a display or RGB LED lamp. The shape of this gamut entirely depends on the technology of the light source.
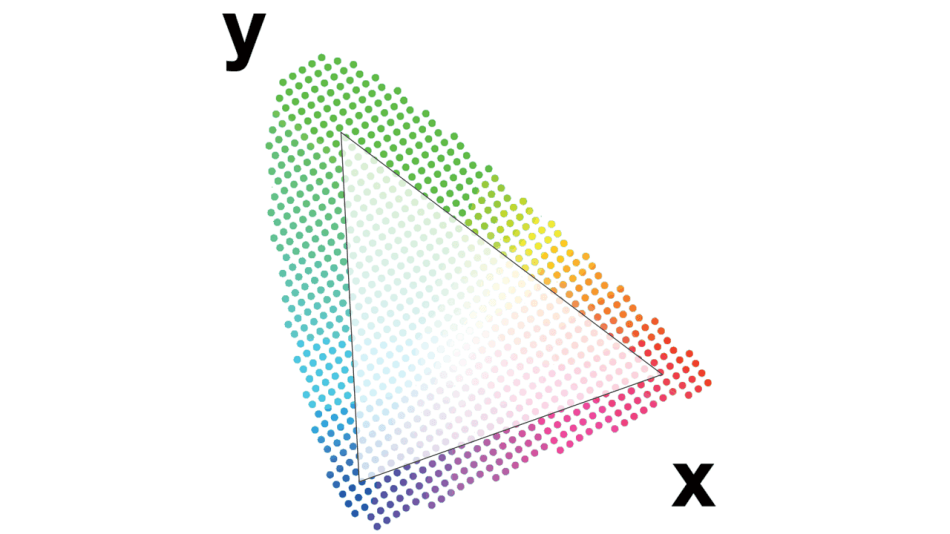
Example of a color gamut that is defined by the color coordinates of three primaries. Any color within the triangle can be made using the primaries located at the vertices. Image Credit: Admesy
Applications of Colorimetry
The use of color is everywhere and being able to accurately produce color for the human eye is therefore in high demand. This is particularly tied into the way products and brands are perceived as there must be an association with a specific color, any other and the association isn’t as strong. Coca-Cola branding and advertisements, for example, must always use the same shade of red to prevent damage to the brand.
The same phenomenon is used to the opposite effect in the branding of cigarette packaging where legislation has made it so that cartons in the EU must now be a nauseating shade of brown. Research has been performed to find that this is the most off-putting color, a dirty-green brown known as Pantone 448 C or ‘opaque couché’. As before, this color must be consistent across the board with no variation. This demonstrates the real need for objective color measurements under different conditions are essential to accurately assess colors.
As well as branding and advertising, the display industries require accurate colorimetry to ensure that the quality of the emitting material and the display glass is of the correct quality and is similar to screens of the same type. Calibration is necessary to make sure that the image displayed on the screen is as similar as possible to the original content. Colorimetry is used for all the various display technologies (e.g. LCD, plasma, OLED) to evaluate the differing color levels and brightness performance.
The Hyperion Colorimeter
The Hyperion XYZ colorimeter is a new high-speed integrated, highly accurate color measurement platform from Admesy. The speed of the system is over 4x faster than past models due to its high sensitivity, making accurate color measurements possible in milliseconds.
The Hyperion colorimeter is available with a number of optic systems including a 10 mm collimating lens or fiber optics for remote sensing. This equipment has excellent filter characteristics, high sensitivity, ultra-low noise electronics and a massive dynamic range, making it ideal for display measurements even at low light levels starting at 0.003 cd/m².
The Hyperion has near perfect CIE1931 XYZ filter characteristics to imitate human vision and provides color measurement in XYZ, Yxy and Yu’v’. A supplied color library makes additional color spaces easily accessible. The Hyperion is also capable of high speed luminance and color measurements for accurate flicker measurements. As the calculations are performed in-instrument, data handling and analysis is streamlined, including JEITA and VESA methods for flicker calculation.
References and Further Reading
- ASTM E 1455-92 “Standard Practice for Obtaining Colorimetric Data from a Visual Display Unit Using Tristimulus Colorimeters,” ASTM Standards on Color Appearance Measurement, 4th Ed.
- Schanda, János; George Eppeldauer; Georg Sauter (2007). "Tristimulus Color Measurement of Self-Luminous Sources". In János Schanda. Colorimetry: Understanding the CIE System. Wiley Interscience. doi:10.1002/9780470175637.ch6. ISBN 978-0-470-04904-4.
- R. W. G. Hunt (2004). The Reproduction of Colour (6th ed.). Chichester UK: Wiley–IS&T Series in Imaging Science and Technology. pp. 11–2. ISBN 0-470-02425-9.

This information has been sourced, reviewed and adapted from materials provided by Admesy.
For more information on this source, please visit Admesy.