Summary
Online viscometers measure the internal viscosity of polymers, proteins, and peptides that are coupled with GPC to characterize essential physico-chemical properties, such as the distribution of molar mass, size, conformation, and branching ratio.
Representing the next generation of viscometers, the ViscoStar III utilizes multiple technological innovations that provide higher standards of sensitivity and stability. This paper describes such innovations and the benefits recorded because of their implementation.
Introduction
In characterizing polymers, online viscometry has long been used alongside gel permeation chromatography (GPC) or size exclusion chromatography (SEC). As shown in Figure 1, a sensitive differential viscometer uses a capillary bridge to measure the small incremental viscosity of a solution that contains a polymer sample relative to the viscosity of the solvent alone.
This value is expressed as the unitless ‘specific viscosity’ ηsp. Its value is divided by the concentration, determined by an online concentration detector such as the Optilab T-rEX differential refractive index (RI) detector, to calculate the intrinsic polymer viscosity η.
While intrinsic viscosity (IV) is considered as an inherently valuable property of the polymer, it becomes more salient when coupled with other experimental data, such as multi-angle light scattering (MALS) data acquired with a DAWN HELEOS II MALS detector.
Analyzed together with concentration, MALS provides a first-principles analysis of molecular weight and size that is free from reference standards or column retention volume. The molar mass range that may be concluded using MALS is between 200 Da to 1 GDa. Meanwhile, the size range for root mean square (rms) radius that could be determined is between 10 nm – 500 nm.
Figure 2 illustrates that a single detector GPC based on column calibration may yield to unreliable molecular weight results, while MALS results are robust and accurate.
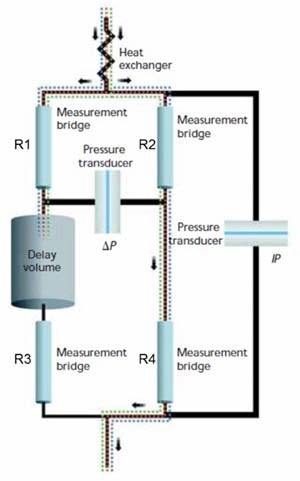
Figure 1. The capillary bridge used in a differential viscometer. IP and DP are the integral and differential pressure transducers. The bridge is balanced (so that DP=0 when pure solvent flows through all four resistive capillaries R1-R4) by adjusting the resistance ratios R1/R3=R2/R4. Sample measurement is made when sample flows through R1, R2 and R4, while the delay column passes solvent to R3. The specific viscosity is calculated as ηsp=2DP/(IP-4DP).
The co-analysis of MALS and IV becomes even more relevant since simultaneous MALS-IV calculations produce multiple sample properties, including:
- Mark-Houwink-Sakurada parameters
- Hydrodynamic and root mean square radius from 1 nm and up
- Conformation (random coil, branched, globular)
- Branching ratio, branches per molecule and drainage coefficient
Especially if they are strongly fluorescent, some polymers are unresponsive to MALS analysis. Because they are index-matched to the solvent (dn/dc=0) or the solution is optically opaque, such polymers scatter weakly. For such applications, online viscometry may be used without MALS in order to characterize molecular weight through the following channels:
- Universal calibration – A technique that assumes ideal (steric) sample-column interactions.
- Mark-Houwink-Sakurada analysis – a technique that utilizes empirical parameters determined separately for each sample or solvent combination.
Whether the technique used is SECMALS-IV or SEC-IV, clean measurements of intrinsic viscosity require more than the basic technology.
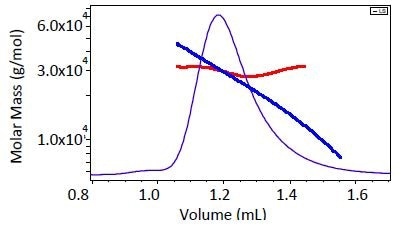
Figure 2. Comparison of single-detector GPC (blue) and MALS analysis (red) of molecular weight for a 29 kDa polystyrene standard. While MALS shows a narrow molecular weight range around 29-30 kDa, column calibration by definition implies that the peak is polydisperse from 20-40 kDa.
Overcoming the Challenges of Online Viscometry
The magnitude of ηsp for a low-concentration polymer that progresses from GPC column elution may be on the order of just a few parts per million (ppm), making differential viscometer highly sensitive.
Despite this, it must simultaneously present immunity to pressure and temperature fluctuations that occur as a result of HPLC pump pulses or room temperature variations, and which could yield various pressure signals that are comparable to, or even greater than, those from the sample. Technological advances in differential viscometry primarily aim to improve sample sensitivity whilst overcoming environmental noise signals.
Pump Pulse Immunity
HPLC pump operators understand that periodic pressure pulses are important in operation. These pulses are often the ultimate limiting factor to quantitation for refractive index (RI) HPLC concentration detectors, although a well-designed device is expected to overcome such pulses as well as to suppress the optical response well below ppm levels.
Differential viscometers, however, are supposed to measure pressure changes. As such, overcoming such pulses is less straightforward compared to other types of detectors. Typically, there are two layers of technology that address pulse-less IV measurements, bridge balancing, and electronic smoothing.
Bridge Balancing
Typically, the condition of a new instrument, an ideally-balanced capillary bridge, with all four arms presenting equal flow resistance and volume, should, in principle, completely diminish any fluctuations in flow rate.
In practice, however, the pulse-canceling effect that is derived from bridge symmetry will be significant but incomplete and may vary with solvent viscosity and flow rate. Bridges also tend to move out of balance over a certain period of time due to aging and the accumulation of contaminants on their capillary walls.
How It Has Been Done
In an attempt to overcome balance loss, engineers have explored the use of an automated mechanical adjustment of the capillary R3 length through a sliding seal. The bridge is rebalanced when R1/R3 = R2/R4. Unfortunately, sliding seals represent potential weak links in the reliability chain because they are prone to degradation and leaks under aggressive organic solvents.
In the ViscoStar III
As described in US Patent 7,213,439, thermal tuning of the bridge utilizes a non-mechanical method of balancing the capillary bridge through the adjustment of the tuning capillary’s temperature, which in effect adjusts its resistance.
As presented in Figure 3, the tuning element is adjacent to R3. During tuning, the desired mobile phase is run through the entire instrument at the same flow rate during GPC measurement. In the tuning process (Figure 4), the temperature of the tuning capillary is automatically adjusted in order to bring the DP signal to zero, to within 0.001 psi.
The graph presents that a regulation of about 0.03 °C is required to maintain the bridge balance within 0.0001 psi (0.7 Pa). This requirement is easy to achieve, considering that the instrument’s entire thermal enclosure is regulated to within 0.005 °C. The entire process in completed within 10 minutes, making it completely possible to rebalance the bridge daily. Such activity is not advisable.
A better response would be to rebalance each change of solvent or flow rate (or once per week if the same solvent and flow rate are maintained) to ensure top performance. Because thermal tuning is able to speedily respond against leaks, the ViscoStar III could be established as a next-generation device.
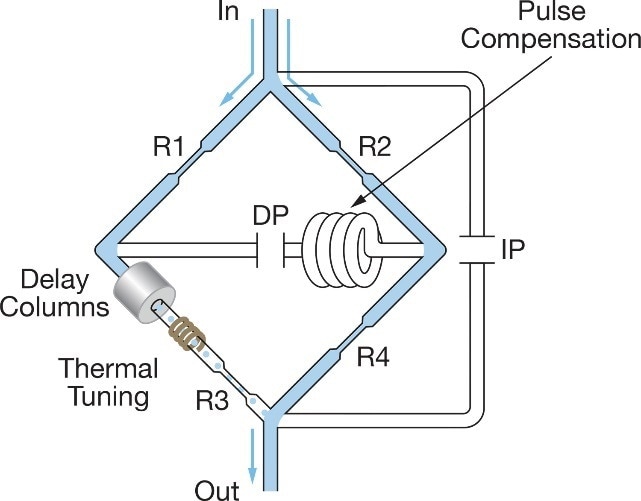
Figure 3. Capillary bridge in the ViscoStar III, implementing thermal tuning of R3 and a pulse compensation element for full impedance matching.
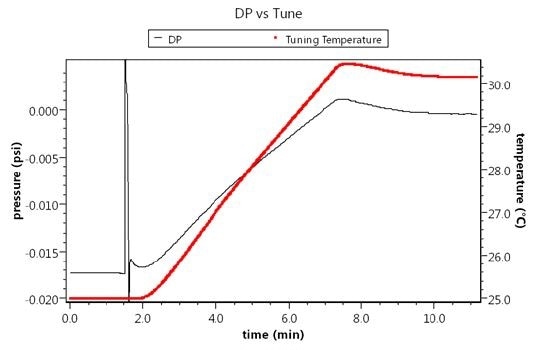
Figure 4. Thermal bridge tuning takes just ten minutes and does not require excessively difficult temperature regulation. The black graph shows the change in DP signal vs. temperature of the tuning capillary.
Pulse Compensation
Realistically, there is no ideal capillary bridge. A delay column in the bridge’s third arm naturally creates volume imbalance, even when four arms are perfectly balanced for resistance. This volume imbalance is not problematic if the flow rate and pressure are constant.
However, the development of a pressure pulse through unequal volumes would imply its arrival at R3 after other capillaries, ultimately manifesting a dynamic imbalance. As a result, pump pulses show up in the IP signal and especially in signals from the super-sensitive DP.
How It Has Been Done
While pulses appear in the IP signal, their impact on overall specific viscosity is small. In reality, DP signals are more complicated and critical than these pulses. DP transducers which have been used during the last couple of decades are membrane transducers.
The sensing membrane in such transducers has a relaxation time of several seconds, facilitating a process of smearing out and hiding pump pulses as a side effect. Simultaneously, the membrane’s long time constant also expands the trailing edges of chromatographic peaks and contributes to resolution loss. As such, previous generation differential viscometers would usually possess mediocre chromatographic resolution.
In the ViscoStar III
The ViscoStar III brings about a multi-layered approach targeted for true pulse compensation and filtering, in comparison with coarse pulse smearing that is associated with peak broadening.
Impedance Matching
Full impedance matching is one of the first advancements in pulse compensation that was introduced at the hardware or fluidics level. In order to compensate for pulse propagation imbalance through the delay column, a second delay volume is added on the opposite side of the bridge. With an appropriate matching volume, pulses propagating on the left and right sides of the bridge reach the DP transducer at the same time and then cancel out.
While the symmetry is not perfect, as shown in Figure 5, impedance matching reduces the DP pulse by about 100 times without losing its chromatographic resolution. The position of the compensation volume adjacent to the transducer implies that it does not affect the static bridge balance, the sample does not pass through it, and it does not severely impact any specific viscosity measurement.
Pulse Filtering
The second advancement in pulse compensation is the matched filtering of the residual DP pulses in software. Because these pulses arrive at fixed intervals, it is easy to determine their frequency or to remove them by using Fourier filtering. Figure 5 shows that this algorithm eliminates entirely residual pulses.
Proprietary Calculation
After the pulses have been eliminated from the DP signal, small fluctuations in the IP remain to affect specific viscosity calculation. The third advance eliminates the contribution of these fluctuations by means of a proprietary algorithm (Us Patent 7,331,218) that utilizes a baseline IP value and calculates sp without reference to instantaneous IP signals.
The multi-layered pulse compensation technology integrated in the ViscoStar III enables better sensitivity that is exclusive on chromatography quality and sample rather than system properties.
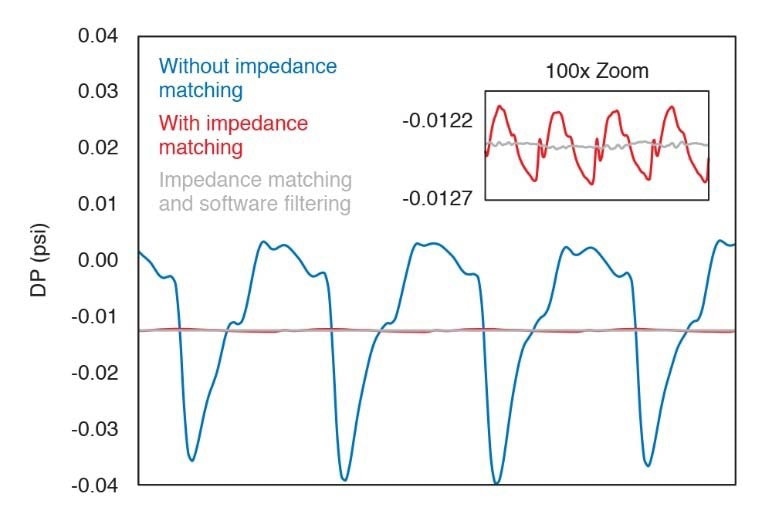
Figure 5. Advanced pulse compensation in the DP transducer signal. The first layer, impedance matching by means of a compensation volume, reduces the amplitude of the pulse by ~100-fold. The second layer, filtering at the pump frequency in software, eliminates residual pulses.
Thermal Stability
The basic elements of thermal stability are good passive isolation and an active thermal element for adjustments and temperature stability. In a differential viscometer, bridge capillaries should be maintained at a constant temperature of around less than 0.01 °C, even when room temperature varies by several degrees Celsius. Because of this, active thermal management is required even when passive isolation is at a high level.
Passive Isolation
In a well-designed viscometer, the capillaries are kept in good thermal contact with each other through a massive thermal sink but are kept well away from room-temperature variations or changes within the instrument. The former is met by attaching the capillaries into a single metallic block, while the latter involves building a well-insulated box around all fluidic and transducer components.
Removing any component, especially the bridge or delay column, from the thermal box or from good thermal grounding opens the system to thermal drift and the corresponding baseline drift of transducer signals. The ViscoStar III was holistically designed with optimal passive isolation kept in check, implementing optimal engineering practices.
Active Regulation
Generally, passive isolation is insufficient for high sensitivity. As such, an active element with feedback is required.
How it has been done
Several instruments work with simple heating elements, but this would normally limit the range of thermal stabilization to 10 °C above room temperature and higher. With heating alone, the instrument cannot be stabilized at room temperature.
More advanced and innovative devices, such as the ViscoStar II, make use of thermoelectric Peltier-based thermal regulation. This mechanism enables the instrument to be heated or cooled. Peltier regulation provides stability at room temperature and lowers temperatures which might be needed for proteins, peptides, or other sensitive samples.
Another aspect of active thermal regulation is the number of active elements and temperature sensors, and their positioning around the thermal box. The design will usually include only a single active element and one or two sensors. Physics dictates that a thermal gradient, radiating out from the single active element, will eventually develop in the instrument. This gradient shall be responsible for some degree of drift.
To a larger extent, the gradient could be controlled through rigorous engineering processes, but it cannot be completely overcome without an additional active element.
In the ViscoStar III
Dual-Peltier distributed regulation of the thermal bench has been implemented in the ViscoStar III. As presented in Figure 6, such design allows active control across a wide temperature range (4 – 70 °C) and removes thermal gradients that are natural to a single-element design. This results in faster thermal equilibration, better isolation from fluctuations in room temperature, and reduced thermal drift.
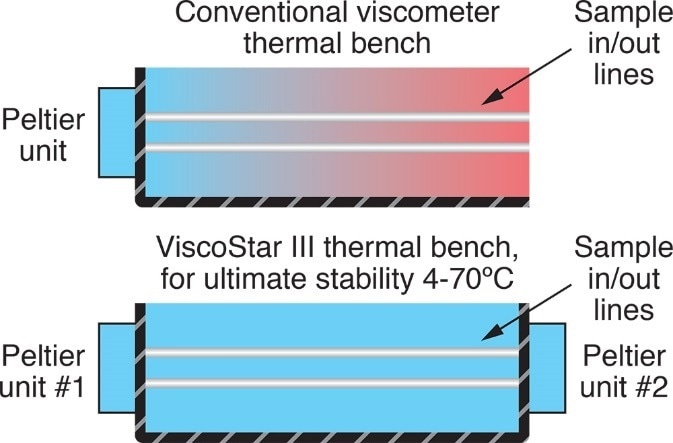
Figure 6. Thermal regulation of the ViscoStar III bench utilizes two Peltier units to eliminate thermal gradients and concomitant signal drift.
Transducer Reliability
The DP transducers used in previous generation viscometers are very sensitive and fragile. Overpressure and corrosion are recorded as the main sources of failure of these instruments.
Overpressure
Excessive pressure could be caused by any combination of high flow rate, high solvent viscosity, and clogged tubing. Different methods have been conducted to protect DP transducers from damaging pressure levels that could rupture the membrane.
How it has been done
Passive protection that is implemented in the ViscoStar II utilizes a standard HPLC backpressure regulator to ensure that any system pressure exceeding the limit could be safely diverted to a waste line. While this method is somehow reliable, it cannot efficiently notify the user of any overpressure. If the sample is diverted to waste, then it is likely that the measurement was corrupted, yet no message about such an event would be relayed to the user.
Additional protection could be done in two ways: by monitoring the DP signal or relieving the excess pressure by opening a transducer purge valve, should the signal exceed the permitted value. These mechanisms are only partial solutions since they do not respond to high system pressures that do not produce differential pressure signals. While the DP transducer is protected, other sensitive components are not necessarily addressed.
In the ViscoStar III
Having an active transducer and system protection implies that all components of the instrument are monitored and protected from overpressure. In the ViscoStar III, an internal sensor and active relief valve replace the passive protection device. When the system backpressure exceeds the safe limit, the relief valve is electronically activated to divert solvent flow, which bypasses the bridge, the DP, and IP transducers.
The ViscoStar III’s system pressure sensor provides a continuous pressure reading that could be accessed over various time periods to determine the build-up of clogging or any need for system maintenance. If the valve is activated due to overpressure, then the user, after being notified, may facilitate remedial action such as aborting a measurement.
The ViscoStar III design, having to rely on an internal software, includes a ‘normally open’ valve that diverts solvent flow to bypass the bridge when the instrument is turned off. As such, components are still fully protected even when the device is not being used.
Corrosion
Highly sensitive magnetic differential pressure transducers utilized in differential viscometers are oftentimes made from 410 stainless steel with welded Inconel caps. The 410 stainless material, particularly the weld joints between it and Inconel, are prone to corrosion by salt-containing aqueous solutions. Because of this, the use of online viscometers in protein applications or similar setups that require moderate to high salt or extreme pH levels is limited.
How it has been done
A primary method to reduce susceptibility to corrosion is to create the entire transducer from a single material without weld joints; however, magnetic materials are generally susceptible to corrosion by high-salt buffers.
Another solution is to line the wetted parts of the transducer with a corrosion-resistant material such as PTFE3. This method would work well if the coating does not degrade. While both of these provide protection against corrosion, better ways of addressing corrosion are available.
In the ViscoStar III
An efficient transducer would have no wetted materials or joints that are susceptible to corrosion. The ViscoStar III replaces the magnetic membrane transducer with a piezo-resistive transducer that does not require a magnetic metal membrane. In the new DP transducer, all wetted surfaces are 316 stainless steel (a material found in most HPLC systems which has excellent resistance to corrosion, even at high salt concentration) and PTFE.
The entire fluidics path in the ViscoStar III was developed to eliminate all materials that are susceptible to corrosion or damage from harsh organic solvents. This instrument presents with excellent solvent compatibility within a variety of aqueous and organic solvents.
More Benefits
The new DP transducer promises more superiority to corrosion in comparison with other previous-generation devices. Apart from this, the device also has a much faster response time than the magnetic membrane transducer, implying that the benefits of pump pulse compensation that were previously mentioned may be met in terms of reduced peak broadening.
Figure 7 presents the advantage of the piezo resistive DP transducers. For instance, DP peaks as byproducts of SEC separation of the BSA monomer and dimer are significantly narrower in the ViscoStar III than in previous-generation instruments. Due to advanced pulse-suppression technologies, the faster DP transducer response does not result in signal fluctuations coming from pump pulses.
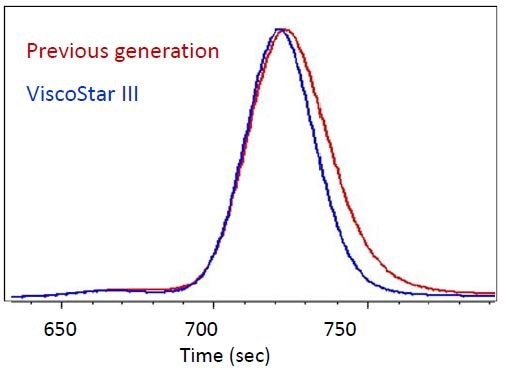
Figure 7. Chromatogram of BSA monomer and dimer, shown in the DP signals of the previous generation of viscometer (red) and the ViscoStar III (blue). The ViscoStar III greatly reduces artificial band broadening induced by the slow DP transducer of previous generations, allowing for resolution of the BSA dimer at 670 sec.
The Next Generation Viscometer
In differential viscometers of previous generations, engineers have found ways to address some of the key challenges. Conventional instruments, despite their questionable reliability, would perform with ease; however, with the ViscoStar III, a higher standard of addressing and eliminating technical pain points is achieved. This realization produces a next-generation instrument with enhanced sensitivity, stability, and solvent compatibility.
Dynamic Range, Sensitivity, and Resolution
A dynamic range is defined as the ratio of the largest and smallest signals that can be measured. It is indicative of all samples and conditions that can be analyzed. The ViscoStar II had a dynamic range of over 35,000:1, exceeding that of competing instruments at least four times. The ViscoStar III extends its predecessor’s range to over 135,000:1, making it, by far, the best available instrument in the market. Figure 8 presents a portion of the large dynamic range.
In Figure 9, presented are improvements in sensitivity and resolution for epoxy resin at various concentrations. The intrinsic viscosity measurements for both the previous (ViscoStar II) and the next generation (ViscoStar III) devices are of a good quality where sample concentration is relatively high and across main peaks.
However, where the concentration is low, for instance at the leading edge from 18 to 24 minutes, ViscoStar III measurements provide more robust analyses. In fact, the sensitivity of the ViscoStar III, at just 0.05 Pa, implies that it could measure with good fidelity an injection of just 0.1 μg of 100 kDa polystyrene. This is three times better than the ViscoStar II and ten times better than competing viscometers.
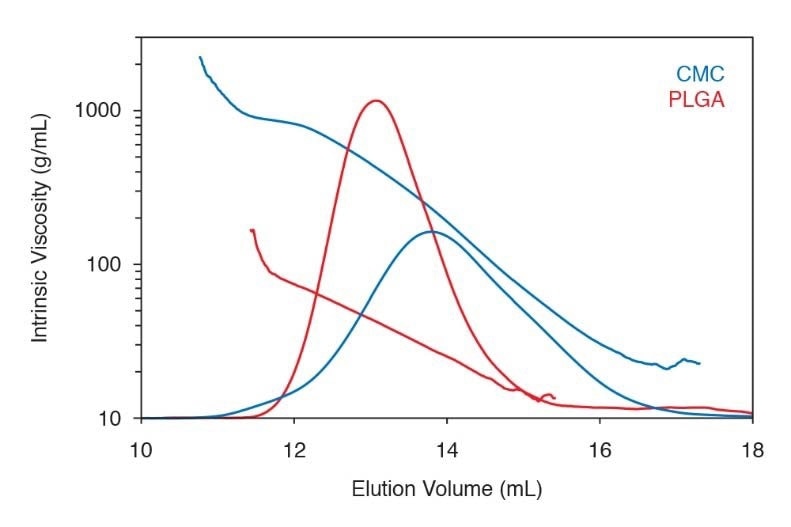
Figure 8. Intrinsic viscosity measurements of poly(lactic co-glycolic acid (PLGA) and carboxymethyl cellulose, covering a large range. Intrinsic viscosity in the single digits is readily measured as well.
Solvent Compatibility
An analytical instrument requires versatility in various conditions and the robustness to resist corrosion. The ViscoStar III has been shown to resist difficult solvents such as:
- THF with 10% formic acid
- 100 mM acetate buffer, pH 3.5
- DMF with 0.1% LiBr
- 1% acetic acid + 500 mM NaCl
- 800 ppm SDS + 250 ppm NaN3
- 100 mM Na2SO4 + 250 ppm NaN3
Stability
The excellent intrinsic viscosity results presented in Figure 9 indicates the stability of the ViscoStar III throughout the whole process. Other tests indicate superior isolation from room temperature fluctuations that may eventually result from air conditioner cycling. In fact, the ViscoStar III’s baseline drift is 50 times better than that of competing instruments, promising efficient and consistent performance throughout extended runs or multi-injection sequences.
With the ability of Wyatt’s ASTRA chromatography software to control third-party HPLC pumps, the implications for processing many samples independently, over a certain time period and using top-of-the-line GPC equipment and detectors, is clear.
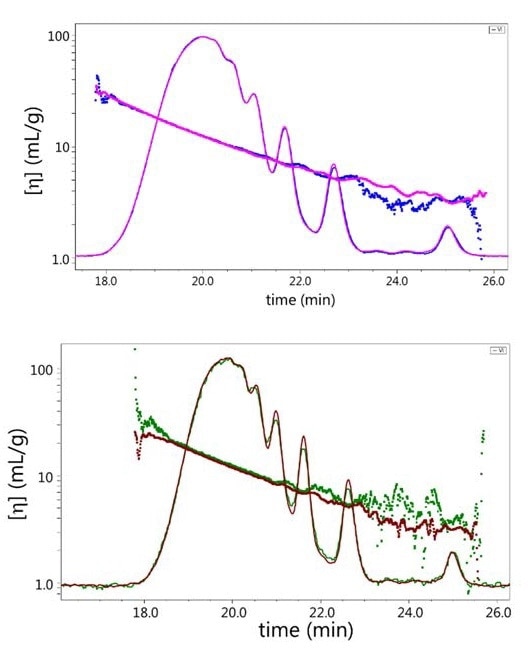
Figure 9. Intrinsic viscosity of epoxy resin. Top: 100 μL injection, ViscoStar II (blue) vs. ViscoStar III (magenta); bottom: 12.5 μL injection, ViscoStar II (green) vs. ViscoStar III (brown). While the intrinsic viscosity results are of good quality across the primary peaks for both the previous generation viscometer (ViscoStar II) and the next generation (ViscoStar III), where the sample concentration is low the higher signal-to-noise ratio and measurement quality of the new instrument is obvious.
Conclusions
Representing the next generation of online viscometers, the ViscoStar III presents a major leap in terms of performance and versatility. Coupled with ASTRA and the industry-leading performance of the DAWN HELEOS II MALS detector and Optilab T-rEX refractive index detector, the ViscoStar III is the viscometer of choice for the most complex GPC analyses of polymers, peptides, proteins, and more.

This information has been sourced, reviewed and adapted from materials provided by Wyatt Technology.
For more information on this source, please visit Wyatt Technology.