To generate precise size distributions for polystyrene spheres, varying in diameter between 3 and 125 microns. Number, surface area and volume weighting are measured to enable this.
| |
Measure |
Range of acceptance |
| Applicable Measures |
Equivalent Circular Area Diameter |
3 – 500 microns |
| Circularity |
0 – 1.0 |
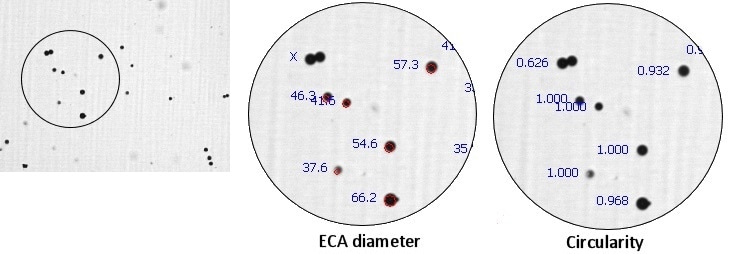
Typical Image
Notes
ECA diameter, which is the logical measure to use with spheres, is the diameter of a circle which shares an equivalent projected area with the actual particle. Beads habitually bunch together, and the real challenge is eliminating these clusters from the analysis. However, by implementing shape rejection, any entity possessing a circularity value under 0.80 is disregarded.
In the sample diagram, there is a double displaying a circularity of 0.626 (shape rejection was momentarily suspended to reveal the value). Fortunately, this cluster is avoided in the actual data acquisition stage.
Results
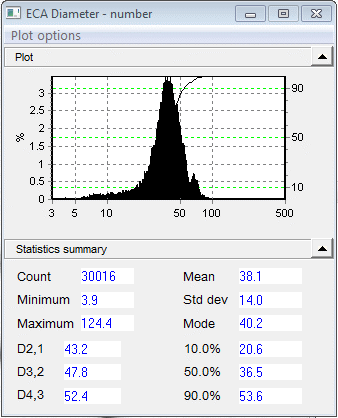
The ECA histogram graph demonstrates that the particles do not form a straightforward, conventional distribution; on the left side, there is a tail of smaller particles, and also a secondary peak at about 60 microns. The desirable (in-focus) particles varied in size from 3.9 to 124.4 microns. The average, in this instance 38.1, is typically implemented as a “single number” sample representation.
The percentiles (10%, 50%, 90%) offer further information regarding how the data is scattered around the average. Compared to a linear axis, the logarithmic size axis provides a superior visual characterization of the distribution nearer the low end. It can do this by “stretching out” the lower end.
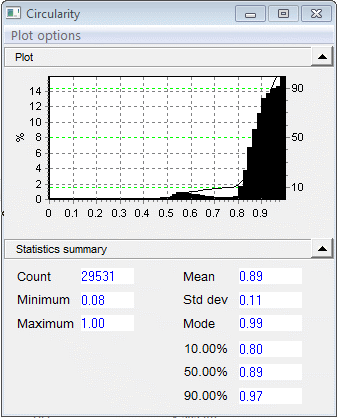
This Circularity plot displays the circularity histogram when shape rejection is suspended. An inspection of particle thumbnail images demonstrates that the counts of less than 0.8 constitute clusters of spheres. However, after shape rejection is established to disregard objects embodying a circularity below 0.8, this section of the circularity histogram ceases to exist. In the size graph, if the small peak of 60 microns disappears following shape rejection, it can be concluded that it constitutes those particle clusters.
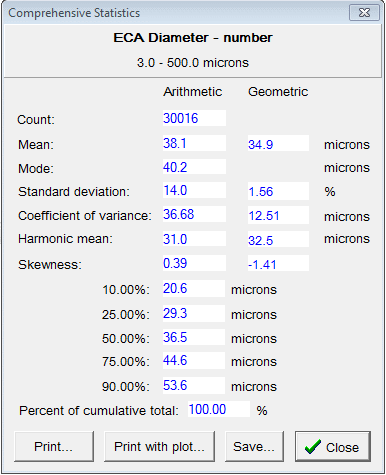
The Comprehensive Statistics designate the sample with even more precision, with the use of established statistics for histogram data. The Arithmetic values derive from the initial data, corresponding visually with how the histogram would be represented on a linear size axis. The geometric statistics provide a visual representation of the log axis distribution; the graph is slanted right in one instance, and left in the other, for example.
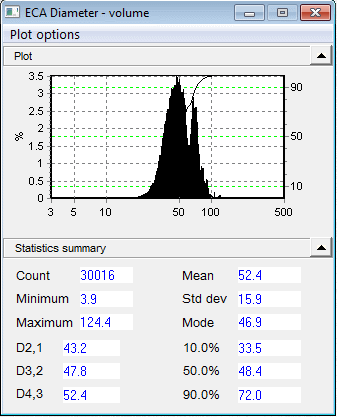
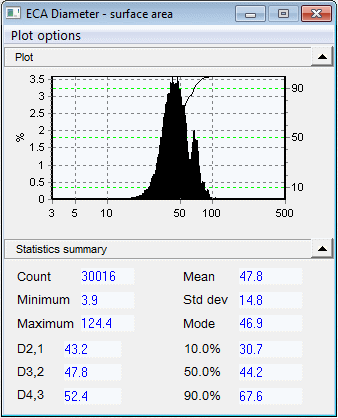
The volume graph exhibits equivalent results, albeit to a much greater magnitude. Volume weighting is utilized when the volume of individual particles significantly impacts upon outcomes, such as in certain chemical reactions. If the distribution is plotted according to surface area, the low-end tail ceases to exist, because those particles yield a minimal contribution to the aggregate surface area. The small peak at 60 is more prominent, because it now embodies a larger proportion of the sample surface area. The entire distribution transfers moderately to the right.

This information has been sourced, reviewed and adapted from materials provided by Vision Analytical Inc.
For more information on this source, please visit Vision Analytical Inc.