In the oil transport and refining sector, corrosion is believed to degrade materials and infrastructure at an estimated cost of $8 billion every year.
Engineers and research scientists with an interest in oil production additives and materials, and the way these products influence the rates and extent of the corrosion, require accurate and rapid techniques for both imaging and quantifying structural damage.
In this context, accurate metrology and high-quality images allow workers to clearly document and trace infrastructural changes over time, and also enable them to effectively characterize the influence of additives and other prevention methods.
3D optical microscopes from Bruker offer exceptional large-field-of-view images at high resolution and also provide highly precise vertical scale information for characterizing the damaging corrosion. These metrology and imaging capabilities are considered as remarkable tools for tracking corrosion in the attempt to limit or control the damaging effects of this unavoidable material and environmental process.
Corrosion is Inevitable, but Controllable
In the oil refining sector, a major problem that is often presented by corrosion is the management of local area failures induced by fracturing and pitting in the surfaces. Crude oils that are being transported do not contribute to corrosion in the pipelines delivering them (the United States alone has more than 2.5 million miles of pipeline). Conversely, corrosion is caused by the unavoidable presence of trace amounts of sediments and water, resulting in leaks or failures over time.
Heavy crude oil is likely to have a higher sulfur or acid content, which is not a major problem in the cool environment of the transportation pipeline; however, sulfur and acid tend to become corrosive at the higher temperatures (200 °C, for instance) of the refining environment.
Finding and Fixing is Not Ideal — How About an Ounce of Prevention?
Mechanical inspection devices called “intelligent pigs” or ultrasonic pulse technologies are used to inspect the pipeline environment routinely. These devices help in detecting areas of heavier corrosion, like the one depicted in Figure 1.

Figure 1. Internal pipeline corrosion shown. Pits, up to 10-mm deep in some cases, can develop.
While a “find it and fix it” method can work against corrosion, scientists are constantly challenged to create better additives, materials, and preventive measures in order to lower and eventually control corrosion and its detrimental effects.
As illustrated in Figure 2, organic coatings take most of the preventive expenditure when it comes to preventing corrosion.
| Costs of Corrosion Control |
| Material & Services |
Range |
Average cost |
| ($ x billion) |
($ x billion) |
(%) |
| Protective Coatings
|
40.2-174.2
1.4 |
107.2
1.4 |
88.3
1.2 |
| Metals & Alloys |
7.7 |
7.7 |
6.3 |
| Corrosion Inhibitors |
1.1 |
1.1 |
0.9 |
| Polymers |
1.8 |
1.8 |
1.5 |
| Anodic & Cathodic Protection |
0.73-1.22 |
0.98 |
0.8 |
| Services |
1.2 |
1.2 |
1.0 |
| Research & Development |
0.020 |
0.02 |
<0.1 |
| Education & Training |
0.01 |
0.01 |
<0.1 |
| Total |
$54.16-188.65 |
$121.41 |
100% |
Figure 2. Costs of corrosion preventive measures
The coatings’ efficacy, and their adherence to surfaces, should be tested on an extremely small scale with the help of highly accurate measurement instruments. Even though corrosion in controlled experimentation occurs on an extremely small scale, it can be used for estimating functional performance over time for huge infrastructures.
Scanning Electron Microscopy — Accurate but Slow and Limited
Scanning electron microscopy (SEM) is one of the many techniques used for measuring coatings. SEM is an extremely precise and accurate imaging method and is used for measuring and testing tiny, localized corrosion pits that are under the influence of material additives and coatings used for preventing or reducing corrosive effects.
However, in spite of being a robust imaging and measurement method, SEM needs a slightly elaborated sample preparation process. During the preparation, the sample is usually sectioned and oriented so that vertical dimensions can be determined along with lateral dimensions, which is significant when attempting to detect and subsequently measure the extent and depths of corrosion pitting.
Furthermore, SEM is often regarded as a two-dimensional (2D) measurement method that offers data about a cross-section of a region of interest, or profiles information, but not true three-dimensional (3D) data, which is required to interpret the nature of 3D corrosion pitting and defects.
Bruker 3D Optical Microscopes Provide Accurate, Fast Corrosion Metrology
It can be difficult to quantify corrosion. There is no single measurement that can sufficiently demonstrate the extent to which a surface has corroded. However, 3D measurement of surface degradations, including pitting, offers an advanced approach to determine, view, and quantify corrosion in a more comprehensive manner.
The interference of light is used by optical profiling to determine the shape and roughness of surfaces. This technique has the potential to resolve surface anomalies, ranging from nanometer-scale roughness through to millimeter-scale step heights, working at scales that are typical of corrosion.
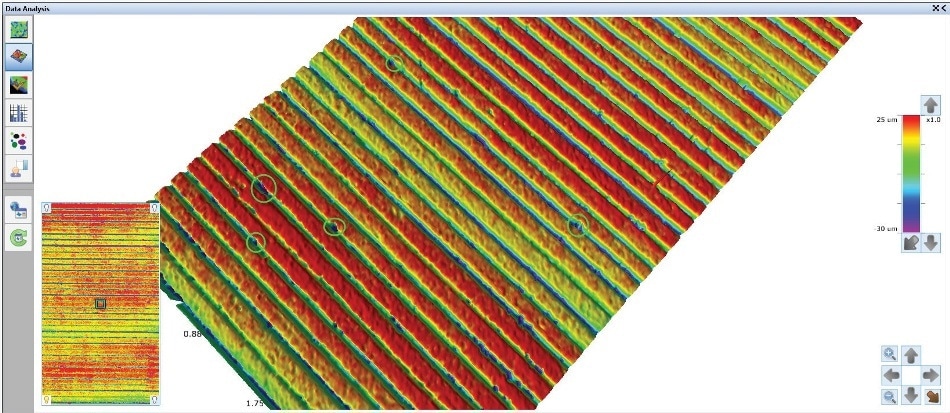
Figure 3. 3D display image of corrosion coupon with representative pits circled in green.
Through 3D analysis, hundreds of parameters can be measured to completely describe surface corrosion, including the directionality of corrosion, ratios of peaks to valleys, the volume of material lost over time, etc.
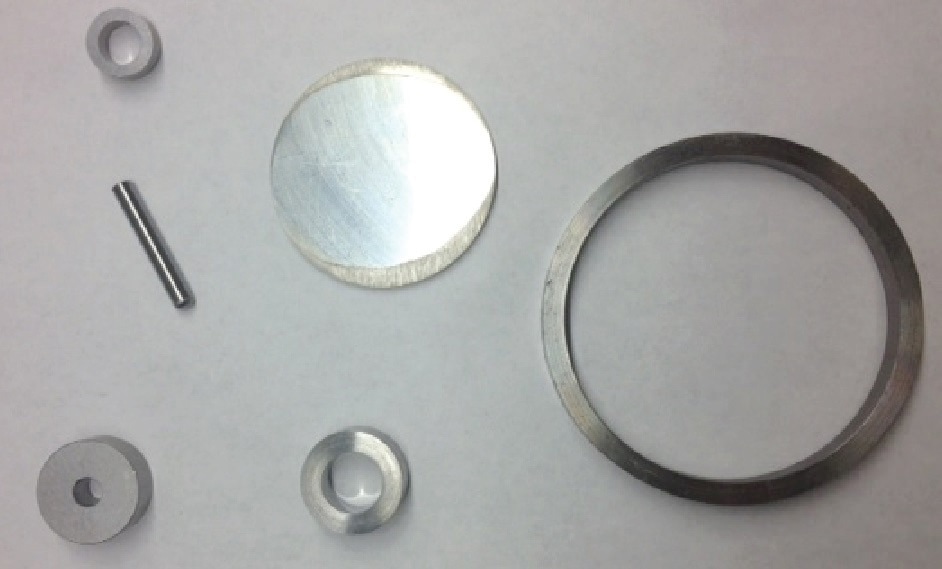
Figure 4. Corrosion coupon samples.
Accordingly, Bruker has developed targeted automation and analysis capabilities for its range of 3D optical microscopes that can reduce both cost and time problems related to product development and corrosion research within the oil and gas sectors. Bruker microscopes are designed to considerably increase the speed at which scientists and engineers can monitor and prove concepts in their research on both coatings and materials — the two largest areas of corrosion prevention costs.
The Vision64® software from Bruker features a powerful Gaussian filter to flatten images, and its multi-regional analysis identifies corrosion pits and quantitatively measures both their volume and size.
Corrosion Coupon Measurements
Corrosion “coupons” are used by a majority of pipeline operators to track corrosion. These coupons are often representative samples of the material from which the pipeline is constructed and are usually in the form of a ring, strip, rod, disk, etc., molded to fit between pipe joints, or into a testing cell.
The coupons are placed in pipelines in strategic sites and then intermittently removed and tested for signs of corrosion. Corrosion coupons are a simple, affordable yet effective tool for achieving a quantitative estimate of the rates of corrosion within a system that is in operation.
These corrosion coupons are weighed both before and after exposure to establish weight loss, and they are also inspected for cracks and pits. Useful information about a material’s life expectancy can be obtained by observing the mils-per-year corrosion rate of an exposed coupon. In addition, the corrosion coupons offer a visual indication of the nature of the corrosion that may be taking place in the system being observed.
The assessment of corrosion coupons is a basic and extensively used technique of corrosion monitoring since they are known to create some of the most reliable physical corrosion proof possible. Corrosion coupons also provide data on the rate of corrosion, the extent of the corrosion, the nature of the corrosion, average material loss, and distribution of localized corrosion.
Corrosion coupon results can detect trends indicating unacceptable or acceptable corrosion protection, the need for enhancements in inspection or protection processes or programs, or gains made by variations to a treatment program.
As shown in Figure 5, the Bruker NPFLEX™ 3D optical microscope platform is a 3D metrology tool that is affordable and perfect for monitoring corrosion coupons.
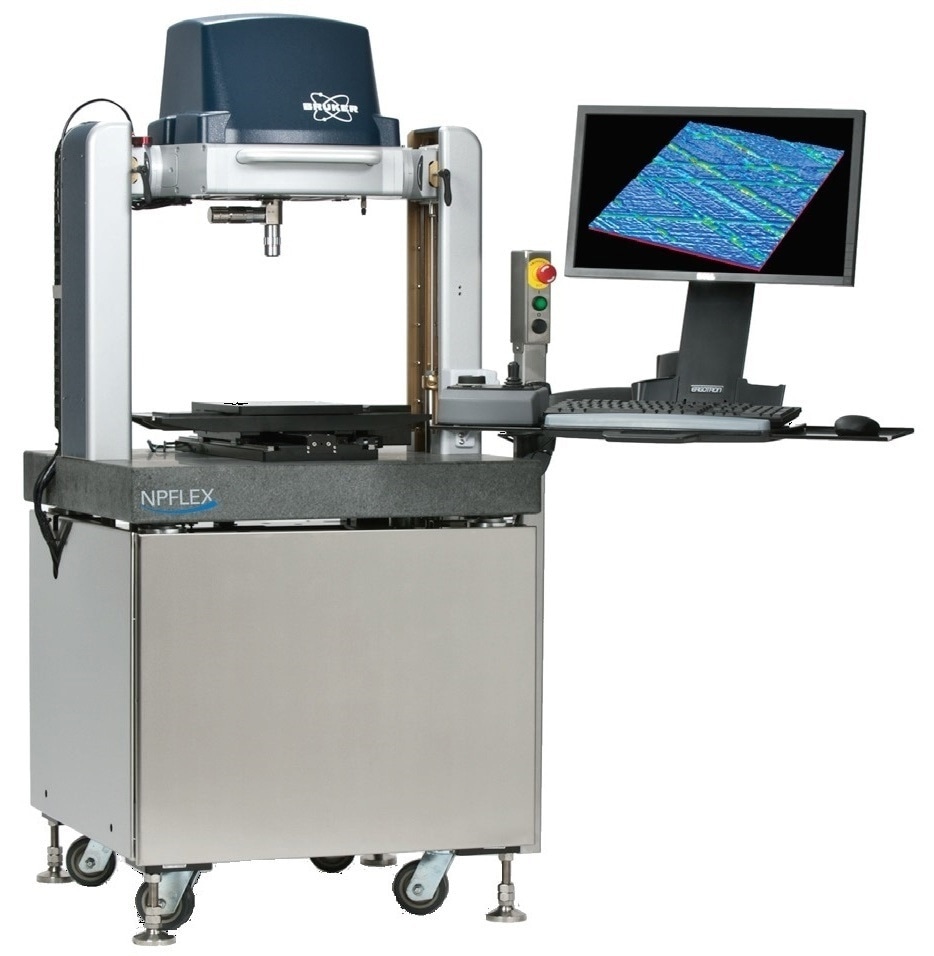
Figure 5. Bruker’s NPFLEX 3D optical microscope. Its large nominal working volume handles small or large sample coupons and multi-sample trays.
The huge working area and XY stage allow the NPFLEX to accommodate massive jigs that can hold many corrosion coupons for inspection purposes (see Figure 6c). This helps in testing a wide range of coatings and materials simultaneously under analogous conditions.
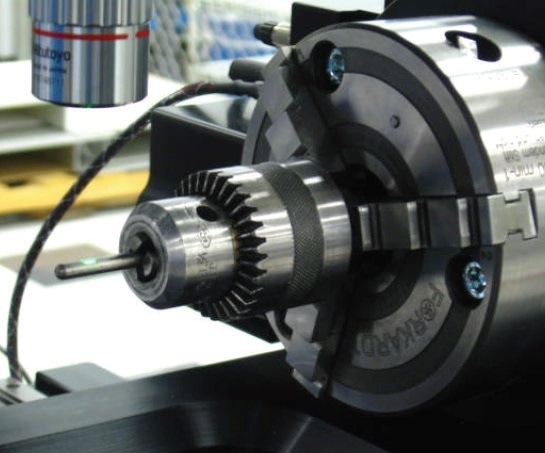
Figure 6a. Measurement of small cylindrical corrosion coupon on NPFLEX.
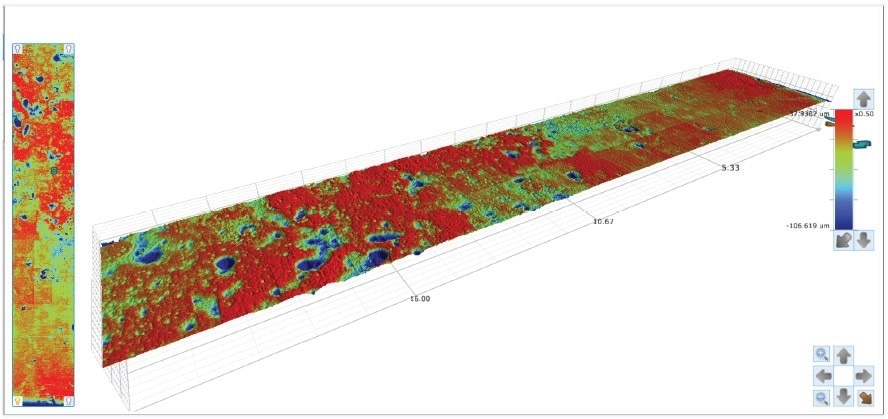
Figure 6b. NPFLEX 3D analysis plot showing corrosion pits. Linear stitched measurement data from a small cylinder coupon was captured with NPFLEX.
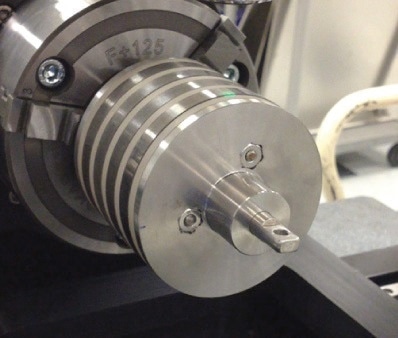
Figure 6c. Metal corrosion coupons mounted on a cylindrical jig on the NPFLEX rotational stage chuck.
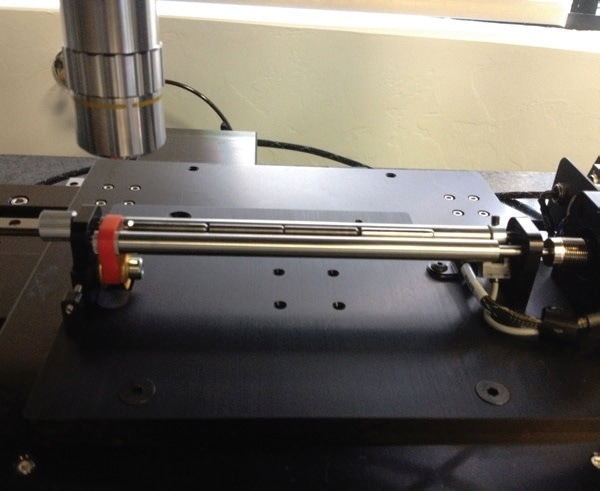
Figure 6d. Multiple small cylindrical corrosion coupons in a multi-coupon jig, ready for measurement.
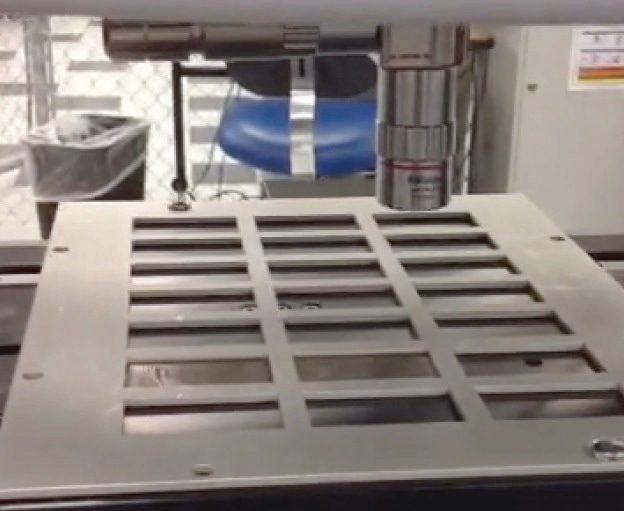
Figure 6e. Automated coupon tray on NPFLEX stage.
More compact optical microscopes present a challenge for imaging internal diameters or positioning larger samples from an end-on perspective. This issue is resolved by the NPFLEX's 3D huge gantry to hold larger parts — for example, custom multi-coupon jigs like those illustrated in Figures 6c and 6d, or corrosion coupon trays as shown in Figure 6e — to establish multiple coupons with a single easy setup.
To accelerate measurements on tiny cylindrical coupons, the NPFLEX 3D optical microscope can be configured with the help of a small roller stage option that enables mounting many small cylindrical components at one go (see Figure 6d). Various multi-coupon holders and the roller stage allow it to obtain data from a number of coupons in one measurement run, minimizing the use of operator time and boosting measurement efficiency.
A major benefit of this kind of instrument is that it can also be utilized near-line in production. The open-gantry bridge design is impervious to vibration levels that are often found in near-line industrial environments, and the built-in air table provides additional stability for repeatable results in a more compact footprint. Through this open-gantry bridge design, both the back and front of the NPFLEX instrument can be easily accessed for ease of support and service. Moreover, the ultra-long working distance objectives make it possible to collect data from hard-to-access areas.
These combined features allow the NPFLEX 3D optical microscope to perform repeatable and multiple measurements on numerous samples, even at complicated angles. Metric surface dimensional data is easily changed into typical reports, offering a metric measurement capability that is similar and objective over time.
The automatic corrosion pit identification and analysis of the system is also of immense value during coatings and materials development processes. Recently developed materials in the research laboratory could be determined against current-generation of materials in use.
Multi-Region Analysis — Automatic Identification and Computation for Analysis
Multiple region analysis, or MRA, is a robust inspection capability provided in Bruker’s Vision64 software. With the help of this special software feature, several different interest areas in the acquired image can be automatically detected and analyzed (see Figure 7).
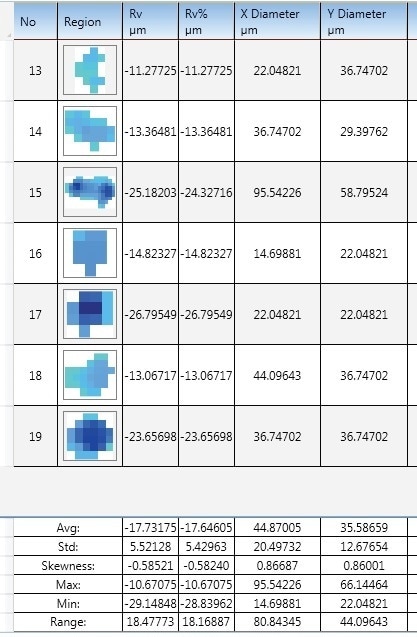
Figure 7. MRA analysis results showing computations on corrosion pits and representative sizes and depths.
For coatings and materials development processes and for corrosion monitoring, this rapid, automated method to detect and monitor the sizes and depths of corrosion is a significant, time-saving feature. The combination of ease and speed through which information can be obtained and subsequently used to interpret experimental results represents considerable cost savings for materials science studies and the fabrication of improved coatings. Since the development of preventive materials and coatings is the area of highest expenditure in the corrosion prevention process, Bruker’s 3D microscopy offers a considerable added value for this sector.
Conclusion
In the oil and gas sector, corrosion represents a challenging and costly problem; however, a number of techniques are available to deal with the challenges with an aim toward increasing reliability and reducing costs.
Bruker’s NPFLEX 3D optical microscope, with its analysis capabilities, automatic data acquisition, and huge sample area, offers a complete solution for those involved in the development of novel corrosion preventive coatings and materials. The 3D optical microscopes from Bruker can bring considerable inspection and metrology cost savings — both in dollars and time — to this critical step in the corrosion prevention process.
References
- Larsen, KR, “Managing Corrosion of Pipelines that Transport Crude Oils,” NACE International, Vol 52 (2013) p. 29-35.
- Koch, G., Brongers, M., Thompson, N., Virmani, Y., and Payer, J.H., “Corrosion Costs and Preventative Strategies in the United States,” US Dept. of Transportation, Federal Hwy. Admin. (2002).
- Thompson, N., “Gas and Liquid Transmission Pipelines,” (2006).

This information has been sourced, reviewed and adapted from materials provided by Bruker Nano Surfaces.
For more information on this source, please visit Bruker Nano Surfaces.