In this interview, Christoph Johann, Ph.D. From Wyatt Technology talks to AZoM about using Field Flow Fractionation to obtain high resolution distributions of nanoparticle size and zeta potential.
Can you give some background on FFF (Field Flow Fractionation)?
FFF has been around for a long time and is growing in its acceptance. This has motivated ISO to publish a new standard with the title “Nanotechnologies-analysis of nano-objects using asymmetrical-flow and centrifugal field-flow fractionation”. That is a big step forward to making FFF an accepted and standardized method, comparable to SEC.
Still, FFF has a reputation for not being easy to use and needing an expert to get the most out of it. I'm here to talk about new developments that make the full potential of FFF accessible to a wider user base. It is a combination of new instrumentation plus sophisticated software. It provides a comprehensive set of data on complex samples that no other single method can provide.
What do you mean when you talk about a complex sample?
A complex sample is one which is not homogeneous, but consists of various components with different sizes and properties, at least one being a nanoparticle.
They cover a size range from a few nanometers to about a micron, and they can differ widely in geometry, chemical composition, and structure. Each of these types of nanoparticles typically has a size and structure distribution.
Once you add other macromolecular compounds, like proteins or polymers, then you get a zoo of sizes and shapes, all in one sample.
A number of applications, including gene delivery, cancer vaccination, drug delivery, and sophisticated industrial applications all depend on complex samples to be functional. The analysis becomes challenging, and conventional methods are not able to provide the required information to optimize the synthesis and to understand how the products work, or why they do not work as expected.
What makes FFF the method of choice for complex samples?
Size is the most important property of nanomaterials, which makes them different from smaller molecules. To illustrate what we are talking about, first consider peptides, which are rather small and readily separated by HPLC. Then, we have an antibody, larger but still in a size range that can be characterized pretty well by columns, like HPLC or SEC columns.
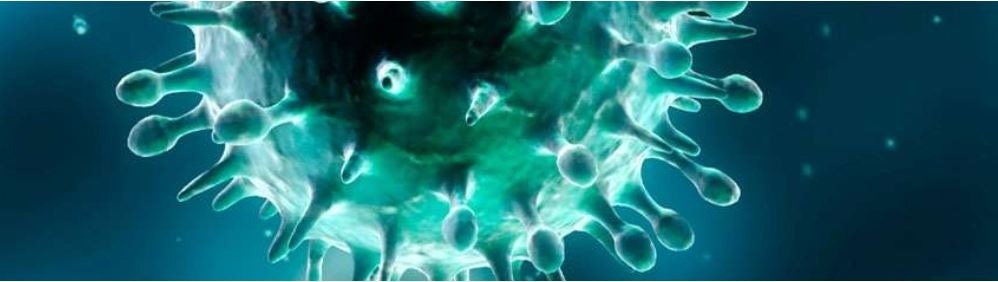
When we compare it to a virus, there is a noticeable size difference, and columns may not be the best method to characterize them, so we need something else. This is where FFF comes into play, as it can separate these large structures, as well as smaller structures, like antibodies or peptides, in the same sample.
What are the advantages of FFF over other separation methods?
FFF physically separates our sample according to size, and furthermore, it is possible to collect fractions. It has a high resolution compared to dynamic light scattering, as well as a wide separation range, and this combination makes it powerful for complex samples. It is gentle, has low shear forces, and therefore is non-destructive.
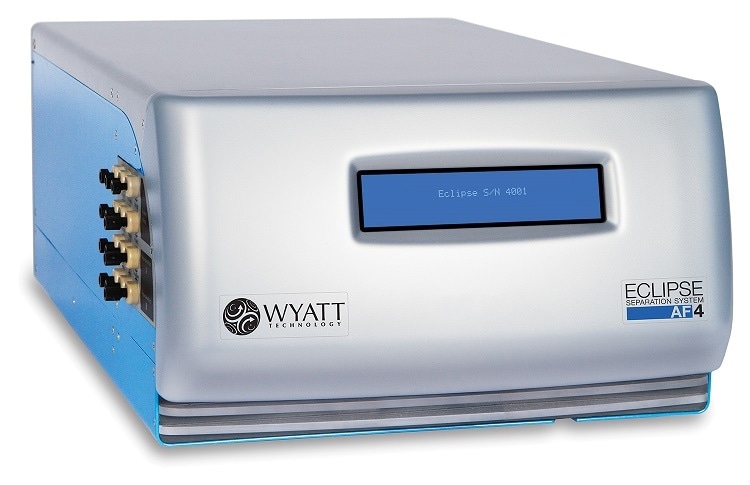
FFF can be coupled online to multi-angle light scattering (MALS), which provides absolute molar mass and size of eluting fractions. With our new development, the Eclipse Mobility, we can determine charge and charge distribution with electrical/flow FFF, an easy upgrade to an existing Eclipse FFF system.
How do your new developments make FFF easier and more robust?
We have concentrated on three features: A seamlessly integrated and automated system; extended data processing capabilities providing molar mass, size, shape, conformation, plus charge and charge distribution; and software-supported method development.
What is the method of operation in flow FFF?
The sample is injected into a thin, ribbon-like channel, which has a porous bottom wall. Part of the flow passing through the channel towards the outlet permeates through the bottom, creating a cross-flow. This cross-flow concentrates the sample towards the so-called accumulation wall, the bottom wall. Brownian motion acts as a counterforce, working against the accumulation. So the molecules are constantly moving up away from the bottom wall, driven by Brownian motion, but they will be pushed back from above by the cross-flow. In a stationary equilibrium, this creates a particle cloud with an exponential decrease of the concentration as a function of the distance from the bottom wall.
Each particle size will have a different average distance from the accumulation wall, determined by its diffusion coefficient. Smaller particles with higher diffusion will be higher up in the channel, and the other way around, bigger particles will stay closer to the accumulation wall.
Laminar flow along the channel creates a differential flow rate that depends on the distance from the wall. The smaller particles travel faster and will elute first, followed by the bigger ones, resulting in a separation.
How do you use multi-angle light scattering (MALS) to obtain molar mass and radius?
A laser beam passes through a cell through which the solution is flowing. The interaction of the light with the electrons of the sample creates scattered light, which is measured by the detectors. They are placed around the scattering center, and in our instruments, we have 3, 8, or 18 detectors which accomodate molar mass measurements from 200 g/mol to 109 g/mol, and size measurements from 10 nm to 500 nm in radius. The instruments with fewer angles have lower upper limits in these ranges.
The scattering intensity is proportional to molar mass and concentration, and from the decrease of the intensity with angle, we can extract the size using a fundamental physical equation.
To calculate the molar mass and size, the scattered intensity is divided by the concentration for each angle and the data are fit by the software. From the intercept of the regression line, we get the molar mass, and from the slope, we can calculate the mean square radius. The result of all MALS measurements is molar mass and size for every slice of the fractogram.
How have you developed the system set-up to allow new and inexperienced users to operate the system?
The key to this is the new software platform that we call VISION. It integrates the complete workflow from method development to the final result. All applications are started from this hub. This includes VOYAGER, which is the software for running experiments, and SCOUT, for method development and for data processing.
There are four steps to developing a method with the SCOUT. First, we define a series or set of sizes which represent our sample, plus the temperature and the solvent. We can also account for the particle’s electrophoretic mobility if electrical/flow FFF is to be run.
The second step is to select a channel geometry such as an SEC channel or a longer channel and spacer.
The third step is to develop the flow program until we have a satisfactory separation. The final step is to export the method to VOYAGER and run it.
How does a simulation compare to a real experiment?
In examples we have run ourselves, the agreement is excellent, with the retention time matching perfectly. We do see that the earlier eluting peak, with the smallest size, is broader in the experiment compared with simulation. That is because the simulation assumes a monodisperse sample, but from the shape of the fractogram in the experiment, we see a size distribution, and MALS confirms that observation.
How is SCOUT used to optimize the experiment after it has run?
Let’s say in our previous experiment we want to increase the resolution between two peaks. They are not fully baseline separated, so we use SCOUT to run different cross-flow gradients and predict how they will affect our fractogram. We found three changes to improve separation: reducing the initial cross-flow, decreasing it over a longer period of time, and then staying at a higher cross-flow at the end of the gradient. SCOUT predicts that the two late-eluting peaks will be more than baseline separated with this method.
Again, this is the comparison of the simulation and the experiment, and there's a good match between the simulation and the experiment. So the simulation is really useful to allow us to achieve the results that we desire.
Calibration is an important step before a size distribution from FFF retention time can be calculated. How is this done in your system?
Calibration of the simulation against channel parameters can be done in two ways. Either a channel height calibration, which assumes that FFF theory is fully applicable to our sample and we then use only one parameter, the effective channel height. The second option is running a set of calibration standards. SCOUT allows the use of both schemes and can compare the resulting size distributions.
Are you able to trace the performance in this FFF system?
All data and system traces are saved with the data file and can be viewed and compared using SCOUT to verify the validity of the experiments.
The Eclipse instrument has a very high reproducibility of cross-flow, which is critical for high-precision measurements. If something would go wrong, the plot of system parameter traces allows us to identify possible problems or outliers at a glance.
What are the key parameters that may be discerned from an Eclipse FFF experiment?
On top of absolute molar mass and size from MALS, it can give the hydrodynamic radius from retention time. Also, by adding an electrical field, we can determine electrophoretic mobility values, which can then be converted to zeta potential. Conductivity, pH, and temperature are measured in real time and provided as data traces.
You mentioned applying an electrical field to the channel? How is this used to determine electrophoretic mobility?
We call this method electrical/flow FFF. By adding two electrodes to the flow FFF channel, we are able to apply an electrical field parallel to the cross-flow. After focusing the sample with cross-flow alone, we add a voltage in the elution step, where the separation occurs. The two fields superimpose and the retention time of a sample that has an electrical charge will change. From the shift in retention time, it is straightforward to calculate the electrophoretic mobility.
If we choose the polarity of the field such that we have an attractive force towards the accumulation wall, that is a negative charge on the particle and a positive charge on the accumulation wall, then the retention time will increase proportionally to the electrical field strength.
If we have two species of opposite charge, we will see one fraction moving to shorter retention time, and the opposite charge moves to longer retention time. If we apply a series of increasing electrical field strengths in several experiments, then the retention time will increase in proportion to the electrical field strength.
We can calculate the charge on several components in the sample simultaneously. This is a capability that a batch measurement, in principle, does not have, like a conventional zeta potential measurement using light scattering.
How can you use fractionation to gain information on proteins?
Protein charge depends on conformation and of course on solution conditions such as pH or ionic strength. We can use EAF4, electrical/asymmetric-flow field-flow fractionation, to measure the charge of proteins with very little effort.
We also have promising first results that indicate we can use charge, measured by EAF4, as a parameter to identify stress on the antibody that we cannot necessarily see in a changing molar mass.
About Christoph Johann Ph.D.
Dr. Christoph Johann is the founder of Wyatt Technology Europe GmbH and has been active in polymer, biopolymer and protein analysis for over 20 years.
He earned his PhD in 1985 in Physical Chemistry at the University of Mainz. In the same year he was the co-founder of PSS Polymer Standards Service GmbH, a start-up company that offered model polymers for research purposes and developed SEC columns.
In 1993 he left PSS and founded a second company, Wyatt Technology Deutschland, now called Wyatt Technology Europe. The company has grown with the proliferation of multi-angle light scattering in the pharmaceutical industry.
Disclaimer: The views expressed here are those of the interviewee and do not necessarily represent the views of AZoM.com Limited (T/A) AZoNetwork, the owner and operator of this website. This disclaimer forms part of the Terms and Conditions of use of this website.