2D materials combine the weak van der Waals (vdW) out-of-plane interactions with the strong covalent in-plane bonding. These materials show excellent conductive, thermoelectric, optical, superconductive, and photovoltaic characteristics, and hold potential for applications in nanoelectronics and optoelectronics devices.
Various 2D materials have been explored, some of these include semiconductors (MoS2, MoSe2, WSe2), insulators (h-BN) and others. The characterization of materials is crucial to identify and explore their structure.

Figure 1. HORIBA LabRAM Soleil Raman microscope.
Raman spectroscopy is a non-destructive and powerful characterization tool that can be used to examine 2D materials. It can characterize the structural properties of 2D materials, in addition to detecting the band structures, layer thickness, strain effects, concentration, electron–phonon coupling, doping type, and interlayer coupling.
An application of hyperspectral micro-spectroscopy for WS2 nanostructures characterization is presented below, using both Photoluminescence and Ultra-low frequency Raman analyses.
Instruments and Methods
The HORIBA LabRAM SoleilTM is a Raman multimode microscope which provides the highest throughput in the market, with no compromise on resolution. This is due to the unique optical design of this microscope based on dielectric mirrors, with very low signal loss, coupled with high quality gratings.
In order to obtain the best quality spectra required for both Photoluminescence and ultra-low frequency Raman analyses, all of these outstanding characteristics are necessary.
By definition, photoluminescence is the most appropriate technique for band structures characterization at the micron scale as the luminescence band of a semiconductor informs directly about the bandgap energy.
Additionally, a precise characterization of the number of layers of a 2D material is permitted by a Raman analysis very close to the laser line. In this spectral range specific interlayer vibration modes are excited.
In order to characterize these materials as much as possible, possessing both spectroscopy methods, ultra-low frequency Raman and photoluminescence on the same instrument, is a crucial feature.
It becomes easy to reach alternatively 5 cm-1 frequency and high wavelength range, due to the fully automated modules for photoluminescence (PL) and ultra-low frequency (ULF) available on LabRAM SoleilTM.
Results
Firstly, the band structure of the chosen flake was characterized, acquiring its PL map, Figure 2 shows the resulting distribution. Two main areas are observed, they are differentiated by their exciton band positions and intensities.

Figure 2. Photoluminescence characterization of the WS2 flake. (Left) PL reference spectra. (Right) 2D PL map based on decomposition on reference spectra.
The characteristic spectra shown on Figure 2 for the two main areas suggest a monolayer area (purple) and a multilayer area (yellow). Both of them have a specific band gap energy of respectively 1.918 eV and 1.923 eV.
The ULF range of the Raman spectrum was investigated directly in order to characterize the exact number of layers and their distribution over the flake. This spectral range is known to show the interlayer modes, expressing the coupling between layers.
Focusing on the ULF region, a Raman map of the flake was gathered, this is shown in Figure 3 with two interlayer modes highlighted. The first one (12-15 cm-1) shifts from higher to lower frequencies, increasing the number of layers. It corresponds to a stretching mode (S mode).
The second mode goes the other way, it is a lateral bending mode (LB mode), (20-22 cm-1). It is easy to differentiate the number of layers applying a multivariate analysis of all spectra (MCR tool of MVAPlus LabSpec 6 software suite) based on these alterations of position of modes.
It results in the colors of the ULF Raman map of the flake (Figure 3). At the micro-scale, the amount of layers are easily differentiated and localized on the sample. Compared with a PL map, it adds the counting step on the number of layers and confirms that the photoluminescence effect is quenched on multilayer areas.
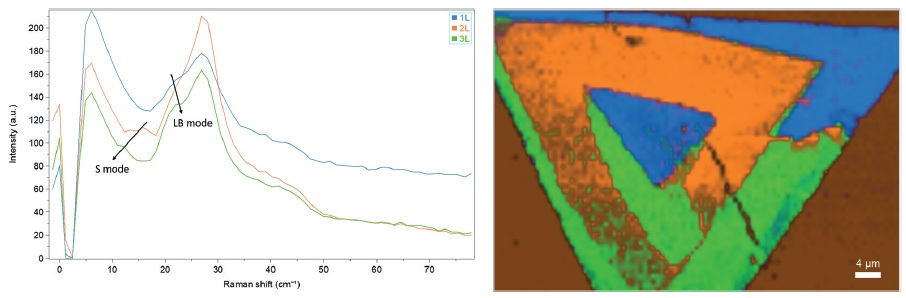
Figure 3. Ultra-low frequency Raman characterization of the WS2 flake. (Left) ULF reference spectra. (Right) 2D ULF map based on MCR analysis.
Conclusion
Correlated PL and ULF microscopies allow a precise structural characterization of 2D materials, as shown on this WS2 sample. Being able to switch from one to the other spectroscopy method with the click of a mouse is a crucial point to consider for an application such as this.
Acknowledgments
Produced from materials originally authored by Thibault Brulé and Céline Eypert from HORIBA FRANCE SAS.

This information has been sourced, reviewed and adapted from materials provided by HORIBA.
For more information on this source, please visit HORIBA.