Fluorine is a widespread element in the crust of the earth produced in rocks and minerals as fluorides. The prevalence of fluorine in the crust has an average of approximately 650 ppm (parts per million) and is predominantly found in gabbros, basalts, granodiorites, andesites, granites, and rhyolites.
Significantly higher fluorine concentrations are found in marine phosphorites, with an average of more than 30,000 ppm. Fluorine mineral deposits are found in a diverse range of geological settings and in a range of forms related to or enclosed within sedimentary rocks, metamorphic rocks, intrusive igneous rocks, or volcanic rocks.
The most abundant and prevalent fluorine mineral is Fluorite (CaF2) which is found as vein fillings in rocks that have been exposed to hydrothermal activity. These veins frequently include metallic ores such as sulfides of copper, zinc, silver, lead, tin, and additional metals.
The vugs and fractures of certain dolomites and limestones can also contain fluorite. Fluorite can be granular, euhedral, or massive as cubic or octahedral crystals. Fluorite is a widespread mineral in carbonate and hydrothermal rocks found across the globe.
Fluorite (CaF2), also called fluorspar in industry, additionally has important applications in metallurgy such as ceramics manufacturing, steel production, and hydrofluoric acid production as a precursor for other manufactured products.
Fluorite specimens with extraordinary color are cut into ornaments and gemstones, whereas optical grade fluorite with above-average clarity is utilized for lenses in optical systems.
This study identified the content of fluorine in rock samples through graphite furnace AAS, employing the contrAA® 800 G High-Resolution Continuum Source Atomic Absorption Spectrometer with a solid sampler for the direct measurement of finely ground samples.
Instrumentation
The contrAA® 800 G graphite furnace AAS with SSA 600L direct-solid autosampler supplied with a liquid dosing unit was utilized to evaluate a selection of geological reference materials to determine fluorine concentration. The finely ground samples were tested as received and they required no further sample preparation.
Fluorine was identified by quantifying molecular absorption bands of gallium monofluoride (GaF) where fluorine is stoichiometrically converted when combined with a gallium solution.
Fully automated analysis of up to 84 solid samples can be performed using the SSA 600L autosampler, including transport to the graphite furnace, the weighing of samples, and the addition of reagents and modifiers.
The samples were manually administered onto graphite sample carriers (normally between 0.05 and 0.5 mg) and were weighed automatically utilizing the integrated microbalance.
Samples were weighed to a precision of 1 μg and molecule forming reagents and process modifiers were introduced through the liquid dosing unit, comprising 8 µL of aqueous gallium standard (1000 mg/L).
Calcium standard solution (2 mg/L) and zirconium standard solution (1 g/L) were used to condition the graphite sample carriers before analysis. The solutions sodium acetate (NaAc 10 g/L) and Pd/Mg/Zr (0.1%/0.05%/20 ppm) were utilized as modifiers to ensure fluoride was stabilized throughout the drying procedure.
Method Parameters
Two furnace techniques were produced to cover the predicted range of fluorine concentration within the samples utilizing a mixture of two GaF molecular absorption lines. Table 1 below demonstrates the selected wavelengths and their corresponding concentration ranges.
Utilizing the more sensitive 212.181 nm absorption line, a multi-point calibration for lower fluorine concentrations was developed from the United States Geological Survey AGV-2 (Andesite) reference material.
The less sensitive 209.419 nm absorption line was used on GPS-1 (Grandiorite) reference material to identify greater concentrations of fluorine. For each wavelength, multi-point calibrations were produced from single reference standards by changing the material weight, and consequently, the total mass of fluorine.
Table 1. The wavelength, reference material, and calibration range used to generate calibration curves.
| Wavelength (nm) |
USGS Reference Material |
Certified Value [mg/kg] |
Conc. Range [mg/kg] |
| GaF 212.181 |
AGV-2 |
440 |
50 - 500 |
| GaF 209.419 |
GSP-1 |
3630 |
500 - 5000 |
Graphite Furnace Temperature-Time Program
Figure 1 and Table 2 illustrate the temperature profile and program for GaF 212.181 nm. An equivalent program was employed for GaF 209.419 nm, but this had a slightly higher atomization temperature.
Table 2. Temperature-Time program for GaF 212.181 nm.
| Wavelength (nm) |
TPyr [°C] |
TAtom [°C] |
Ramp [°C/s] |
| GaF 212.181 |
250 |
1750 |
1400 |
| GaF 209.419 |
250 |
1850 |
1400 |
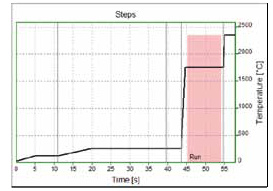
Figure 1. Temperature-Time profile for GaF 212.181 nm.
Evaluation Parameters
Table 3 displays the evaluation parameters such as the measurement time, the background correction method used, the width of the spectral window for observation, and the number of pixels used for peak integration.
To reduce the influence of other molecular structures within the spectral observation window, Iterative Background Correction was chosen.
Table 3. Measurement and spectral evaluation parameters.
| Wavelength (nm) |
Eval. pixel |
Measurement Time |
Spectral Observation Width |
Background Correction |
| [s] |
[nm] |
[pixel] |
| GaF 212.181 |
3 |
9.0 |
0.23 |
200 |
IBC-m |
| GaF 209.419 |
4 |
5.0 |
0.25 |
200 |
IBC-m |
Results and Discussion
Tables 4 and 5 show the results of seven geological samples, with the inclusion of five certified reference materials. Basalt and two Andesite samples including fluorine in the range of around 200 - 400 mg/kg were quantified utilizing the 212.181 nm molecular absorption line.
Rhyolite, Granite, and two unknown samples were determined to have higher concentrations of fluorine ranging from around 800 – 4400 mg/kg, employing the 209.419 nm absorption line which had less sensitivity.
Each analysis was carried out in triplicate and the average results are noted along with the measurement variability. The accuracy of the technique was confirmed as the measured concentrations were consistent with the established values for the known reference materials.
Table 4. Results for fluorine in Basalt and Andesite reference materials using GaF 212.181 nm.
Calibrated on AGV-2
(Andesite) - 440 mg/kg |
Measured Concentration [mg/kg] |
Certified Concentration [mg/kg] |
| BHVO-1 (Basalt) |
421 ± 25 |
385 ± 31 |
| JA-2 (Japanese Andesite) |
245 ± 24 |
223 (200-485) |
| JA-3 (Japanese Andesite) |
266 ± 24 |
286 (SD=45) |
Table 5. Results for fluorine in Rhyolite and Granite reference materials using GaF 209.419 nm.
Calibrated on GSP-1
(Grandiorite) - 3630 mg/kg |
Measured Concentration [mg/kg] |
Certified Concentration [mg/kg] |
| JR-1 (Japanese Rhyolite) |
860 ± 99 |
991 (SD=112) |
| PYR-1A |
1170 ± 98 |
NA |
| NIG-1A |
2720 ± 92 |
NA |
| NIM-G (Granite) |
4300 ± 91 |
4200 |
Calibration
Figures 2 and 3 show the multi-point calibration graphs produced for the two molecular absorption lines of GaF. Figure 2 presents the calibration graph created for the GaF 212.181 nm molecular absorption line utilizing USGS AGV-2 Andesite reference standard employing various sample weights.
The calibration graph produced for the GaF 209.419 nm molecular absorption line is shown in Figure 3 which employed the USGS GSP-1 Grandiorite reference standard using various sample weights.
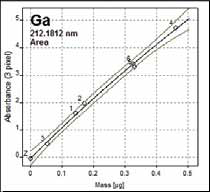
Figure 2. Solid calibration with AGV-2 (440 mg/kg). R2 = 0.994. Calibration function: nonlinear rational.
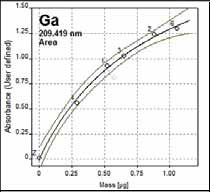
Figure 3. Solid calibration with GSP-1 (3630 mg/kg). R2 = 0.992. Calibration function: nonlinear rational.
Signal Profile and Spectral Region
At wavelengths of 212.181 nm and 209.419 nm, fine-structured, molecular absorption spectra of gallium monofluoride were detected as illustrated in Figures 4 and 5 below. Figure 4 presents the spectral region and signal profile for the GaF 212.180 nm molecular absorption line when analyzing the AGV-2 Andesite calibration standard.
Figure 5 presents the spectral region and signal profile for the GaF 209.419 nm molecular absorption line when analyzing the GSP-1 Grandiorite calibration standard.
The contrAA® ASpect CS software offers comprehensive display and editing of the data, including both 3D and 2D visualizations of the spectral region throughout atomization.
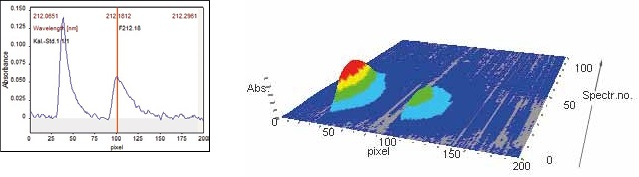
Figure 4. Signal profile and spectral region for GaF 212.180 nm (sample AGV-2).
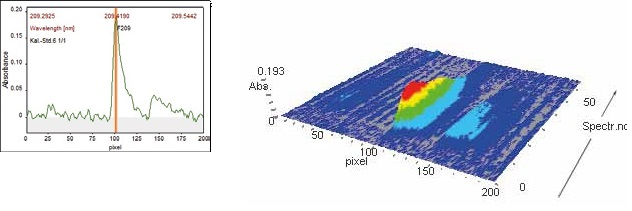
Figure 5. Signal profile and spectral region for GaF 209.419 nm (sample GSP-1).
Correction of Spectral Interferences – CSI
The CSI software feature supplied with the ASpect CS software can be used to easily remove background structure from matrix elements that may occasionally overlap with the desired analyte wavelength.
As with any AAS, these interferences can potentially arise on the contrAA®, but continuum-source AAS differs in that spectral data is visible and simple for the user to identify.
This makes it easy to exclude interferences by employing the correction spectra of the interfering substances, as demonstrated in Figure 6 below for the 212.181 nm line.
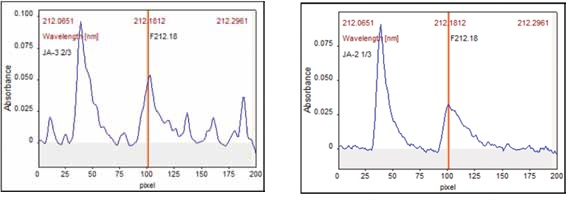
Figure 6. Signal profile for GaF 212.181 nm with and without Spectral Correction.
Conclusion
The contrAA® 800 G with high-resolution optical design and a continuum source Xenon lamp provides the unique ability to identify non-metals like fluorine in geological samples.
The requirement for sample digestion is removed by the direct-solid autosampler which precisely weighs the sample before it is loaded onto the graphite furnace. The contrAA® 800 G has also been proven to effectively identify other halogens such as bromine and chlorine in pharmaceutical, food, and water samples1-3.
References and Further Reading
- Ozbek, Nil; Akman, Suleyman; Determination of Fluorine in Milk and Water via Molecular Absorption of Barium Monofluoride by High-Resolution Continuum Source Atomic Spectrometer; Microchemical Journal, 2014, 117, pages 111-115.
- Ozbek, Nil; Akman, Suleyman; Determination of Chlorine in Milk via Molecular Absorption of SrCl using High-Resolution Continuum Source Graphite Furnace Atomic Absorption Spectrometry; J. Agric. Food Chem., 2016, 64 (28), pages 5767-5772.
- Gunduz, Sema; Akman, Suleyman; Determination of bromine by high-resolution molecular absorption of strontium mono bromide generated in a graphite furnace; Microchemical Journal, 2014, 116, pages 1-6.

This information has been sourced, reviewed, and adapted from materials provided by Analytik Jena US.
For more information on this source, please visit Analytik Jena US.