Refinery samples such as fuels (platformer, diesel, among others) are combinations of different hydrocarbons that are created through the fractionated distillation of crude oil. Their boiling intervals are predominantly in the range of 150 to 390 °C. They are commonly utilized as combustibles or as fuel for automobiles.
Traces of organically bound nitrogen, chlorine, and sulfur can be found within them, originating either from additives or from natural origins. These compounds produce environmental pollutants when fuel is combusted.
As these pollutants are harmful to the environment and to human health, their content (CI, N, S) must be kept as low as possible. Another negative factor is their influence on the lifetime and performance of catalysts that are employed in a number of process steps.
If these unwanted elements are too high in quantity, the product quality and activity of the catalyst (poisoning) can be significantly affected. Permanent quality control is crucial to verify the quality of the product and to follow legal limit values.
The multi EA 5100 is directly designed for the efficient and simple measurement of nitrogen contents in a broad range of concentrations. It combines effective gas purification and drying with the highly sensitive HiPerSens detection, along with catalyst-free high-temperature combustion, to detect nitrogen at a concentration range of 10 µg/L up to 10,000 mg/L, all in the same device.
Materials and Methods
Samples and Reagents
A range of refinery samples (platformer, diesel, gasoline, etc.) were analyzed in this study.
- Pyridine (C5H5N), GR for analysis(Merck Art.-No.: 1.09728.0100).
- Extended standard kit for calibration and test nitrogen (0–25 mg/L) (Analytik Jena, Art.-No.: 402-889.076).
- Isooctane (C8H18), Suprasolv®, GR for gas chromatography (Merck Art.-No.: 1.15440.1000)
Sample Preparation
A pretreatment stage was not required as the samples are light volatile, contain TN at the ultra-trace and middle level, and have a low viscosity. The samples were directly analyzed.
Calibration
Before the determination, the system was calibrated utilizing nitrogen standard solutions based on pyridine (N) in isooctane. Figure 1 outlines a standard calibration curve with performance parameters. Various concentrated standards were used to check the calibration (shown in Table 3).
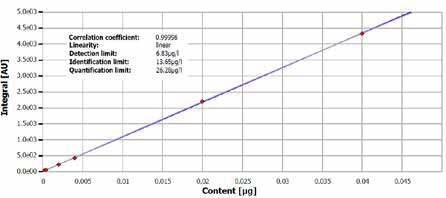
Figure 1. TN calibration, ultra-trace range, curve including statistics.
Instrumentation
A multi EA 5100 was used to perform the measurements, supplied with HiPerSens CLD detection for the identification of nitrogen. The MMS multi matrix sampler equipped with liquids was used to automate the sample introduction and to guarantee a high sample throughput.
Vertical operation mode was selected to run the analyses. The samples were directly injected into the evaporation zone of the quartz glass combustion tube supplied with a quartz pyrolyzer. The liquids autosampler enabled the complete process to be carried out automatically.
The bi-phasic, catalyst-free combustion procedure is performed at temperatures of up to 1050 °C. In the first phase of the process, an inert gas stream is used to evaporate volatile components of the sample, before the gaseous products produced are combusted in an oxygen-rich environment.
The formed pyrolysis products and the heavier, non-volatile sample components are then quantitatively oxidized in pure oxygen in the second phase. The quartz pyrolyzer prevents incomplete combustion, modules the combustion process, and provides uniform evaporation.
This ensures optimal conditions for a reproducible analysis even for the contents of TN in the ultra-trace range. The high-performance dryer and the multi EA 5100’s Auto-Protection system provide sufficient drying, operational safety (aerosol and particle trap), and a total transfer of the formed NOx into the CLD. It is possible to achieve a detection limit as low as 10 µg/L N.
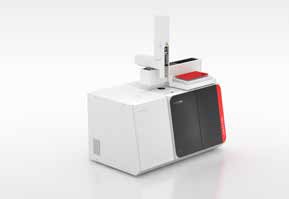
Figure 2. multi EA 5100 with MMS sampler.
Method Parameters
From the method library of the analyzer, the standard method ASTM D4629 was employed for all analyses. The parameter settings for the combustion process are outlined in the following table.
Table 1. Process parameters in vertical mode.
| Parameter |
Specification |
| Furnace temperature |
1050 °C |
| Second combustion |
60 s |
| Ar flow (first phase) |
100 mL/min |
| O2 main flow |
200 mL/min |
| O2 flow (second phase) |
100 mL/min |
| Draw up |
2 µL/s |
| Injection |
0.5 µL/s |
Evaluation Parameters
Standard method settings were used. The following table provides a summary of the parameter settings.
Table 2. Detection parameters CLD.
| Parameter |
Specification NS |
| Max. integration time |
240 s |
| Start |
1.9 ppb |
| Stop |
2.0 ppb |
| Stability |
7 |
Results and Discussion
The samples examined in this study are a representative spectrum from the discipline of the refinery process and quality control. Table 3 provides results that are averages of three replicate analyses of test standards and samples.
An injection volume of 40 µL was utilized for all standards and samples. Figures 3–7 demonstrate standard measuring curves for various samples and for one standard.
Table 3. Results of the total nitrogen determination in different refinery samples and standards.
| Measurement |
TN |
SD |
| Platformer |
0.03 mg/L |
<0.01 mg/L |
| C8 (HC mix) |
0.04 mg/L |
<0.01 mg/L |
| Raffinate |
0.04 mg/L |
<0.01 mg/L |
| Gasoil |
1.38 mg/L |
<0.01 mg/L |
| Diesel (DK) |
2.14 mg/L |
<0.01 mg/L |
| Gasoline (OK) |
5.17 mg/L |
±0.05 mg/L |
| Jet fuel A |
6.48 mg/L |
±0.04 mg/L |
| Heating oil (HEL) |
177 mg/L |
±0.97 mg/L |
| TN Standard (c = 0.10 mg/L) |
0.10 mg/L |
<0.01 mg/L |
| TN Standard (c = 5.00 mg/L) |
5.03 mg/L |
±0.02 mg/L |
| TN Standard (c = 50.0 mg/L) |
50.0 mg/L |
±0.10 mg/L |
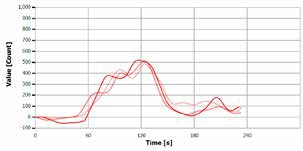
Figure 3. Analysis curve of “C8 (HC Mix)”.
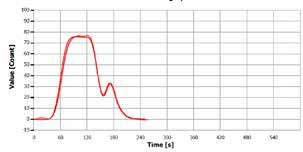
Figure 4. Analysis curve of “diesel (DK)”.
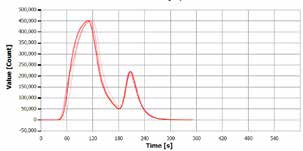
Figure 5. Analysis curve of “heating oil (HEL)”.
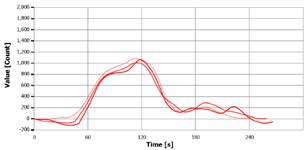
Figure 6. Analysis curve of “TN standard 0.1 mg/L”.
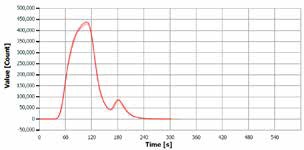
Figure 7. Analysis curve of “TN standard 50 mg/L.
A threefold measurement is usually adequate to acquire results within 3% RSD due to the ideal process conditions. This significantly affects the time taken to process the sample which produces a higher sample throughput.
The results of the analysis achieved and their reproducibility show that the sample combustion was performed to a high quality. The accurate performance of the analysis system was verified by measuring standard materials with known N contents (see Table 3).
Conclusion
The multi EA 5100 is extremely effective in the determination of a broad range of nitrogen contents in various refinery samples (such as gasoline, diesel, biodiesel, and kerosene).
With its novel HiPerSens technology, the detector spans a measurement range of up to 10,000 mg/L with a lower detection limit of 10 µg/L of nitrogen.
The superior sample digestion and treatment of the reaction gas (enabled by the Auto-Protection system) provide high reproducibility, regardless of the digestion characteristics or composition of the analyzed matrix (such as color additives, FAME, and more) and the TN concentration.
The MMS sampler, which has 112 positions for liquids, can be used to easily attain a high sample throughput. For lower throughput requirements, samples can be manually introduced using an autoinjector type Al resp. Al-EA is a possible alternative.
If required, a suitable detection or sampling system can be added to extend the system to analyze other matrix types such as solids and gases, or for the measurement of additional parameters and elements (such as chlorine, sulfur, TOC, carbon, EOX, AOX).

This information has been sourced, reviewed, and adapted from materials provided by Analytik Jena US.
For more information on this source, please visit Analytik Jena US.