In this interview, AZoM talks to Dr. Juan Araneda, Head of Application Chemistry at Nanalysis, about the increasing use and utility of NMR and how it can help with Lithium deposit analysis.
What makes NMR such a powerful tool for chemists?
NMR spectroscopy is one of the most powerful techniques to identify molecules. Using a combination of 1D and 2D experiments, a chemist can elucidate the structure and connectivity of most organic molecules. Because organic molecules are mainly composed of carbon and hydrogen, those are the most commonly used nuclei in NMR.
NMR is such a powerful technique for this application that one of its most important properties is often neglected - NMR is inherently quantitative. If we add a known amount of a reference compound, which is called the internal calibrant, into the mixture, we can use it to quantify the other components or determine the purity of the analyte. And this is referred to as qNMR.
Why is NMR not widely used in industrial settings?
High-field NMR instruments are extremely powerful. They provide high resolution and high sensitivity. They use superconducting magnets that require cryogens. They are very expensive and large, so accessibility is often limited to universities or research centers.
Because high-field instruments are expensive and large, qNMR spectroscopy is not as widely used in industry as other techniques, such as UV-Vis, GCMS, ICP, or IR, but the emergence of benchtop NMR spectrometers has facilitated the incorporation of this technique in industrial settings.
Our benchtop NMR instrument can observe multiple nuclei, for instance, proton, carbon, fluorine, phosphorus, lithium or boron. It's easy to maintain; it doesn't require cryogens because we use permanent magnets. The field of the instrument is 1.4 T, which is equivalent to 60 MHz in proton. It's compact and portable. It only weighs 25 kg and is the size of a small microwave oven, so you can easily move between locations. It even fits into a glove box.
We have everything included in the same enclosure, the magnets, the electronics, and the PC with the touch screen, so you don't need an additional computer to use the instrument. It is easy to use, and it uses regular 5 mm NMR tubes, which is quite convenient.
Why is interest growing in using NMR of nuclei other than 1H?
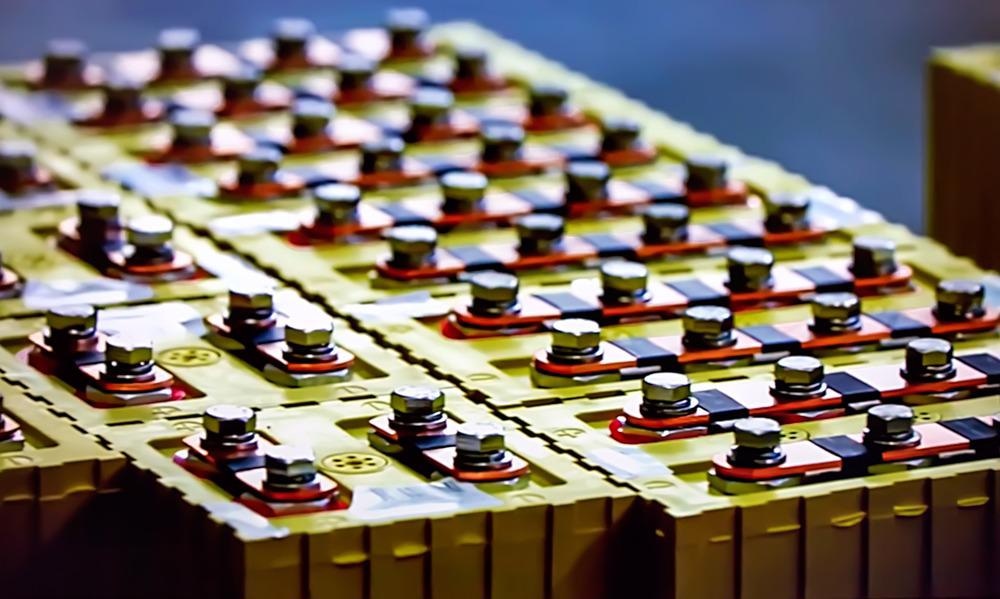
Image Credit: Fishman64/Shutterstock.com
In the last couple of years, we have seen an increasing interest in different nuclei, such as fluorine and phosphorus. One of the main benefits of using heteronuclides, particularly at low field, is their very large chemical shift window compared to proton. This translates to minimizing an overlap, which is ideal if you want to quantify components in a mixture. For example, studies into battery materials have made use of fluorine and phosphorous NMR, to determine the purity of the electrolytes and solvents used.
One element that is getting attention lately is lithium. There are two NMR-active isotopes of lithium; lithium-6 and lithium-7. Lithium-6 has a natural abundance of 7.6%, and lithium-7 of 92.4%. Both are quadripolar with the spins of one for lithium-6 and 3/2 for lithium-7. Because lithium-7 is more sensitive, it's the most used isotope in lithium NMR spectroscopy.
Lithium compounds are used in many industrial processes, such as glasses, ceramics, lubricants, and pharmaceuticals. The importance of lithium in the last two decades has increased due to the superior properties of lithium-ion batteries, which are used in a variety of electronic devices, such as notebooks, cell phones, and cameras.
However, the rising demand for electric vehicles is projected to significantly increase the need for lithium in the coming years. Most lithium is commercially produced from the extraction of lithium-containing salts from underground brine ponds, or from lithium-containing rocks, such as spodumene. The largest lithium-producing country by far is Australia followed by Chile and China. Australia extracts lithium from traditional hard rock mines, but in South America, particularly in Chile, Bolivia, and Argentina, lithium is found in brines.
The commercial process for lithium extraction from brines involves pumping the liquid to the surface into a series of large ponds. There the brines are concentrated for about a year by solar evaporation. While concentrating the lithium, several minerals and compounds are removed by precipitation. The lithium content is monitored at each step until it reaches about 6%. This concentrated solution still contains several impurities, so it's transferred to a recovery plant, where boron, magnesium, and calcium are removed in different stages. Finally, the last step is the precipitation of lithium carbonate using sodium carbonate.
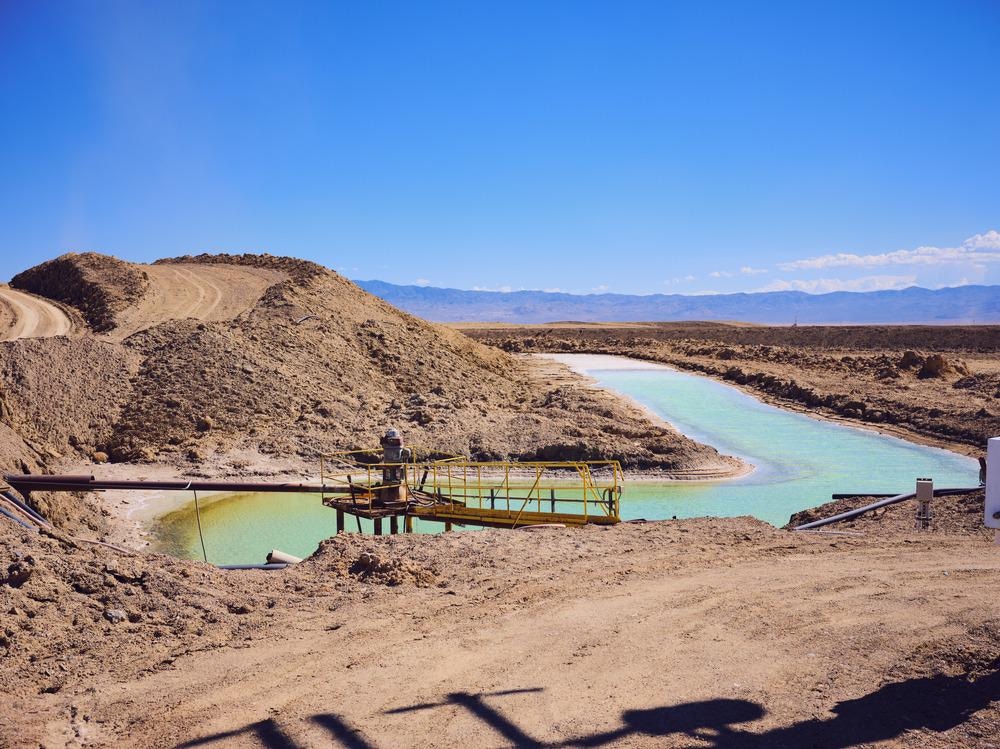
Image Credit: Cavan-Images/Shutterstock.com
As I said, during the entire process, the lithium content is monitored regularly, so you might need to run thousands of samples per week. The most used techniques for this analysis are atomic absorption (AA), or inductively coupled plasma (ICP). However, both methods require significant sample manipulation and are prone to interference caused by the different ions present in the solution, which is referred to as a matrix effect.
You recently published a study on this application of NMR in particular – can you give us an overview of the experiment you ran?
We decided to explore the potential of benchtop NMR instruments in the quantification of lithium in brines to see if we can provide an advantage compared to traditional methods, by simplifying the process or reducing the cost of the experiments. 16 samples from underground brine pools from Salar de Atacama in Chile were obtained from SQM. One set of the samples was sent to Nanalysis in Canada for analysis with NMR, while another set remained in SQM in Chile for analysis with atomic absorption.
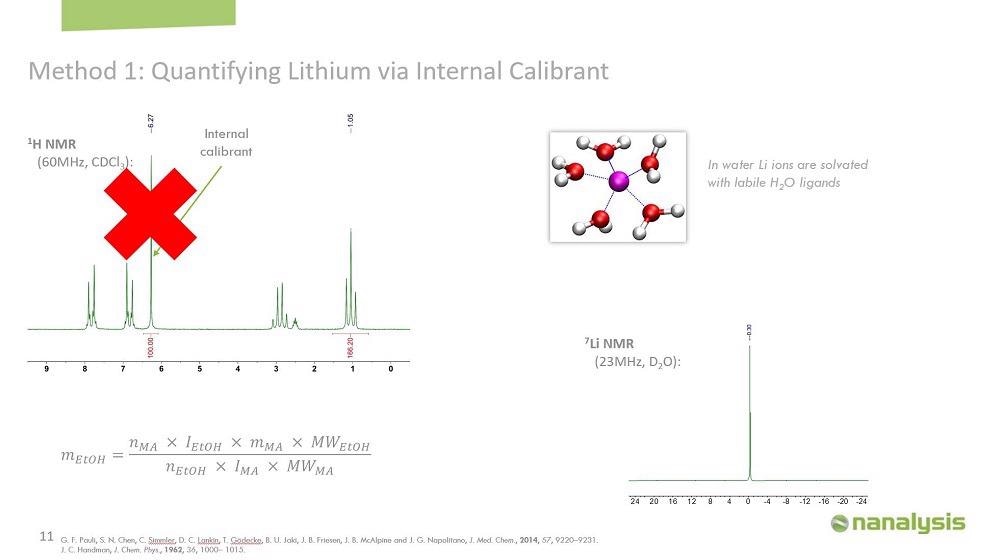
Image Credit: Nanalysis
We can't add an internal calibrant to quantify the lithium content in aqueous brines, because the rapid dynamic exchange of water molecules solvating the lithium ions means that only a single resonance is observed. So instead, we used a calibration curve. This method is very popular in other analytical techniques, such as GC, atomic absorption, or UV-Vis, but it's not as common in NMR. For this method, we first make a series of dilutions of the analyte of interest, and then we plot the integral of one of the peaks versus the concentration. Using regression analysis, we can then use the generated calibration curve to determine the concentration of an unknown sample.
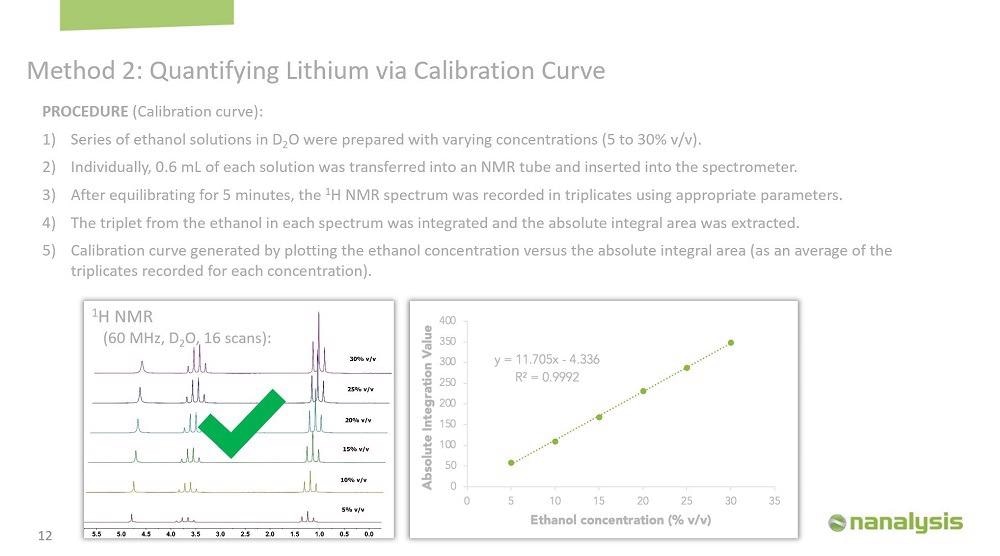
Image Credit: Nanalysis
The first step in a qNMR experiment is to determine the T1 value of the samples because the T1 will help us optimize the parameters for the experiments to minimize the error associated with the measurements. It's very easy to determine the T1 using our instrument. We determine the T1 of all the calibration samples and four random brine samples. The T1 for the calibration samples was between 3-23 seconds, and for the brine samples, the T1s were between 0.01-15 seconds. Therefore, we use a relaxation delay of 115 seconds, which is approximately five times the longest T1.
We made the calibration curve using lithium chloride in water, and the concentration was from 0.25 to 30% by weight. 0.6 ml of each solution was transferred into an NMR tube, and the sample was left in the instrument for five minutes to equilibrate. The spectrum was acquired in triplicates to generate the calibration curve.
The repeatability of the instrument was evaluated by performing an intra- and inter-day experiment. Intra-day precision was evaluated by running duplicate samples of lithium chloride at 15% concentration by weight. The inter-day precision was studied by analyzing the same sample in duplicate for six consecutive days. In both cases, the absolute integration area was monitored, and the relative standard deviation ranged from 0.03 to 0.3%, showing excellent precision.
We also performed a longer stability study by running four brine samples twice a day for 22 days. This demonstrated that the instrument is very stable, even over a long period of time.
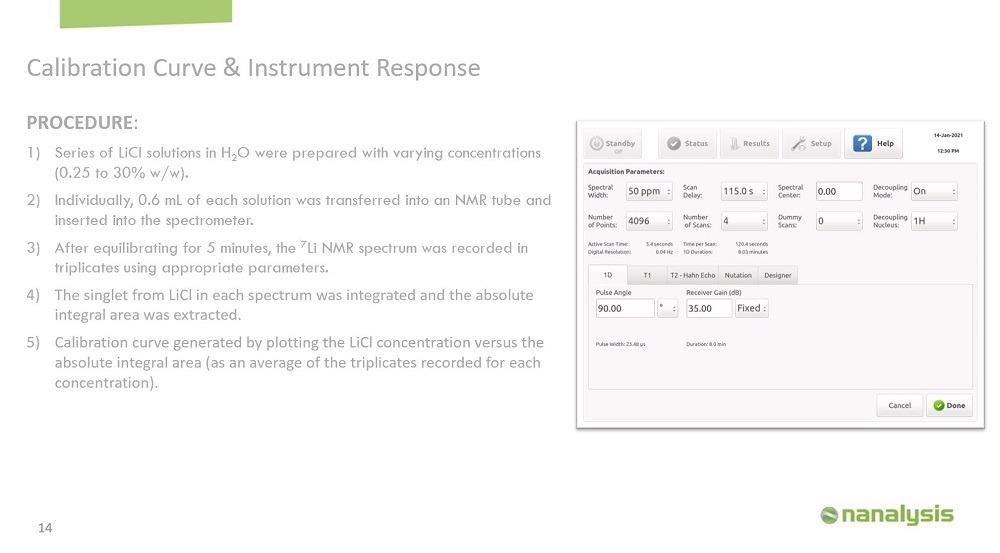
Image Credit: Nanalysis
Precision and bias were also evaluated following the American Public Health Association (APHA) guide for method development and evaluation. A certified standard solution of lithium carbonate for ICP containing 1000 ppm lithium was analyzed in 10 replicates. The standard deviation was determined to be 11 ppm and the bias was 1 ppm. The detection limit (LOD) for this application was established as the lowest concentration of lithium that gives a signal to noise ratio equal to or higher than three, and the limit of quantification (LOQ) as the lowest concentration that gave a signal with a signal to noise ratio of 10. In this method, the LOD was determined to be 40 ppm of lithium, and the LOQ was determined to be 100 ppm of lithium.
The method was used to analyze real brine samples. The samples were analyzed by NMR directly from the brine pools - no deuterated solvent was added, and no sample preparation or dilution was performed. In all cases, the relative standard deviation values for the NMR samples were below 2%.
Regression analysis comparing the results from NMR and AA demonstrated a very strong correlation between the two techniques, with an R2 value of 0.9996.
Is benchtop NMR a viable and cost-effective solution for this type of lithium analysis compared to them?
Following our study, we estimated the rough return of investment for using benchtop NMR for this application, by looking at the initial capital cost and general operating expenditures for NMR and atomic absorption. The initial cost is slightly higher for NMR, but the operating cost and maintenance are significantly cheaper, making it an excellent alternative instrument to quantify lithium in brines. Some lithium mines can run more than a thousand samples per month, so their return on investment could potentially be quite high.
Even though traditional methods used in the lithium mining industry, such as ICP and atomic absorption, provide lower LOD and LOQ than NMR, NMR methods provide more than sufficient signal-to-noise to analyze real brine samples.

About the researcher
Dr. Juan Araneda, Nanalysis' resident citizen of the world, was born in Venezuela and raised in Chile. He moved to Calgary in the mid-2000s to pursue Chemistry at the UofC under the supervision of Warren Piers. Unable to contain his enthusiasm for the Calgary winter, he opted to remain in the Great White North, bringing his expertise to our Application Chemistry team. Since then he's been acquiring multi-nuclear spectra and naming compounds on the coolest benchtop NMR's around!
Disclaimer: The views expressed here are those of the interviewee and do not necessarily represent the views of AZoM.com Limited (T/A) AZoNetwork, the owner and operator of this website. This disclaimer forms part of the Terms and Conditions of use of this website.