In several food and beverage markets, bourbon barrel-aging is a widely used trend. This process involves repurposing a charred oak barrel that had already been used to age bourbon for aging a different beverage or food product, in general for several months.
In the process, the beverage or food can absorb flavors from the oak barrels and the residual bourbon in the barrels. In addition, flavors already present in the beverage or food can infuse into the barrel and/or sustain reactions with time.
The process adds a complexity of flavor and value to the products and has been used for treating wines, beers, syrups, liquors, coffees, sauces and teas.
This article investigates particular chemical differences between bourbon barrel-aged maple syrup and regular maple syrup. This analytical goal was achieved by isolating the chemical components in the sample using two-dimensional gas chromatography (GCxGC).
This technique involves coupling two columns with complementary stationary phases to enhance the peak capacity relative to using either phase alone as a single dimension separation.
This leads to chromatographic isolation of more individual analytes in these complex samples. When this robust separation is paired with time-of-flight mass spectrometry (TOFMS), the isolated compounds can be chemically identified based on matching with spectral databases.
GCxGC-TOFMS generates rich data that can be mined later using data analysis software tools. This helps unravel the meaningful information and solve the analytical questions.
This article describes the use of ChromaTOF Tile to quickly compare the raw data over the sample set to identify class-differentiating features, the particular chemicals that differentiate the bourbon barrel-aged maple syrup from the regular maple syrup.
Experiment
HS-SPME and GCxGC-TOFMS were used to analyze two types of syrup samples — one bourbon barrel-aged and one regular. Distilled water was used to dilute the samples to about 50% (1 g syrup per 1 mL water). Each diluted syrup measured in a 2-mL aliquot was subsequently added to a 20-mL HS-SPME vial.
Incubation of the samples was performed at 40 °C for 5 minutes. They were then extracted at the same temperature for 10 minutes using a tri-phase SPME fiber (PDMS/DVB/Carboxen, Supelco). Table 1 illustrates the GCxGC-TOFMS conditions used for the experiment.
For each syrup type, data was obtained in quadruplet, and the SPME fiber was conditioned for 5 minutes at 250 °C between injections.
Table 1. GCxGC-TOFMS (Pegasus® BT 4D) conditions. Source: LECO Corporation
| Auto Sampler |
LECO L-PAL 3 Autosampler |
| Injection |
2 min desorption in GC inlet, splitless |
| Gas Chromatograph |
LECO GCxGC QuadJet™ Thermal Modulator |
| Inlet |
250 °C |
| Carrier Gas |
He @ 1.4 mL/min, corrected constant flow |
| Columns |
HP-5 MS, 30 m x 0.25 mm i.d. x 0.25 μm coating
Rxi-17SilMS, 0.45 m x 0.25 mm x 0.25 μm coating |
| Temperature Program |
Hold 2 min at 40 °C, ramp 10 °C/min to 280 °C
Secondary oven: +20 °C relative to primary oven |
| Modulation |
2 s with temperature maintained +15 °C relative to 2nd oven |
| Transfer Line |
300 °C |
| Mass Spectrometer |
LECO Pegasus BT |
| Ion Source Temperature |
250 °C |
| Mass Range |
35-550 m/z |
| Acquisition Rate |
200 spectra/s |
The same techniques were used to collect data for an alkane standard to carry out Retention Index (RI) calculations. LECO’s ChromaTOF software helped automate and control sample acquisition, and ChromaTOF Tile was used to find and identify the class-distinguishing features.
Results and Discussion
Figure 1 depicts the representative contour plots of the bourbon barrel-aged and regular syrups. Both samples exhibit some similarities and some unique differences. The main aim of the analysis was to find and comprehend these chemical differences as they could be associated with the barrel-aging process.
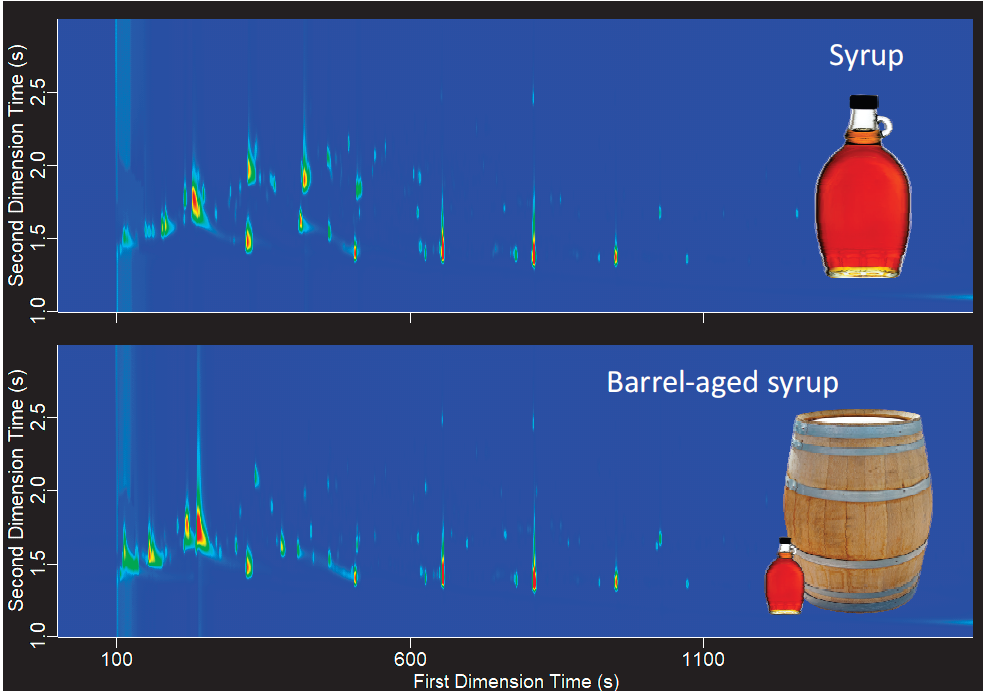
Figure 1. Representative chromatograms of bourbon barrel-aged and regular maple syrup. Image Credit: LECO Corporation
Certain differences are evident in the TIC and these could potentially be identified by performing a visual comparison of the chromatograms. Yet, other differences could be more challenging to identify without using comparative software tools.
Low-level features may not be visible in the TIC and other differentiating features may be masked by the complexity of the sample and coelution.
LECO’s ChromaTOF Tile can be useful in finding these differences from the data by quickly identifying spots in the chromatogram (retention windows and specific m/z) that differentiate the sample groups in a statistically meaningful way.
The comparison is performed on each m/z in the raw data to unravel features that may not be visually evident and offers better insights into the sample groups and their differences.
Pyrazine, illustrated in Figure 2, is one of the most differentiating features between both syrup types. Pyrazine was only found in the regular syrup (samples 5–8, dark brown bars) and not in the barrel-aged syrup (samples 1–4, light brown bars).
ChromaTOF Tile identified the location in the data where this feature emerged and then returned a tentative identification using the spectral and retention information.
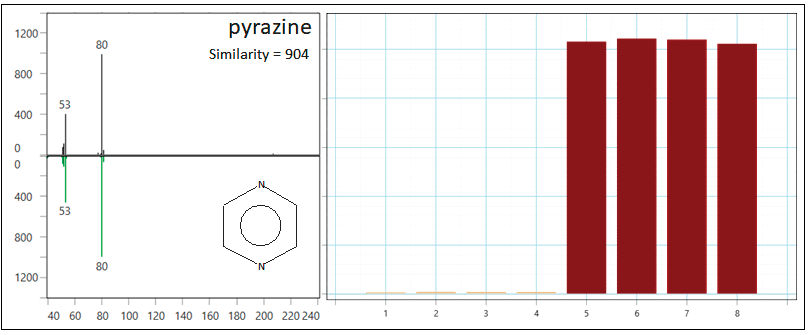
Figure 2. Pyrazine was determined as a class-distinguishing feature through ChromaTOF Tile. It was identified through spectral and RI matching and is observed at higher levels in the regular syrup (samples 5-8, dark brown). Image Credit: LECO Corporation
The top part of Figure 2 depicts the observed spectral data and the inverted part of the left panel of the figure shows the library match, with a similarity score of 904. A retention index with an observed RI value of 745 compared to the library RI value of 736 supports the tentative identification.
Pyrazine is described with “nutty” aroma descriptors, and this is possibly a crucial difference with implications in the aroma profile.
ChromaTOF Tile had a vital role in unraveling this significant difference in the samples. Figure 3 depicts a review of the TIC in this retention area, indicating that pyrazine may have been challenging to determine with only a visual comparison of the TIC.
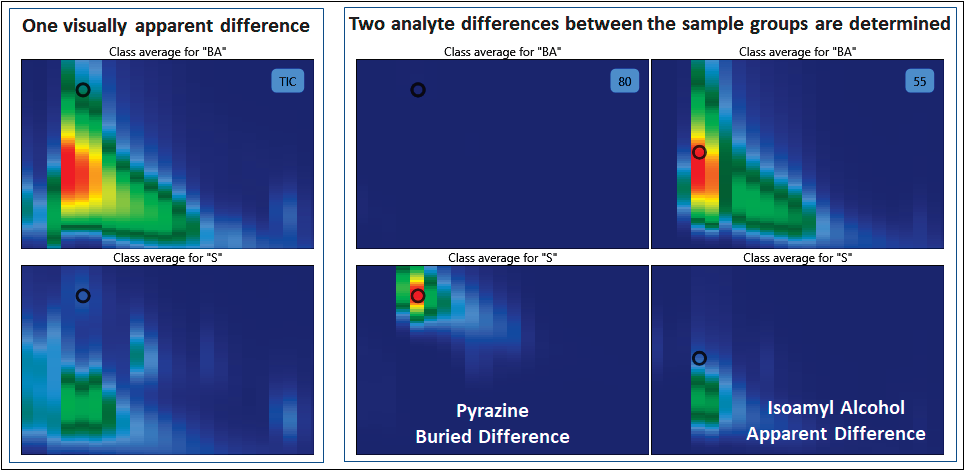
Figure 3. The average chromatogram for the barrel-aged syrup (top) and regular syrup (bottom) are shown for the TIC (left), m/z 80 (middle), and m/z 55 (right) in the chromatographic window around pyrazine. Image Credit: LECO Corporation
The left panel of Figure 3 shows a comparison of the averaged TIC chromatogram for the barrel-aged syrup samples (top) with the averaged TIC chromatogram of the regular syrup samples (bottom). The black circle marker pinpoints the retention time for pyrazine, where the difference is not so evident.
Quite evident in the TIC is a difference for a feature found to be higher in the barrel-aged syrup.
The right panel of Figure 3 illustrates this feature observed in the XIC for m/z 55, where the feature obscures pyrazine in the TIC. Although pyrazine is not clear in the TIC, it can be observed using XICs for m/z 80, depicted in the middle panel of Figure 3.
The second difference could possibly have been observed in the TIC. However, by investigating all m/z with ChromaTOF Tile, both the class-differentiating features were identified.
Figure 4 illustrates the details for the second feature depicted in Figure 3. This feature was identified as isoamyl alcohol and was noted at higher levels in the barrel-aged syrup (samples 1–4, light brown) than the regular syrup (samples 5–8, dark brown).
ChromaTOF Tile identified this difference, where the identification was assigned from both the spectral and retention information.
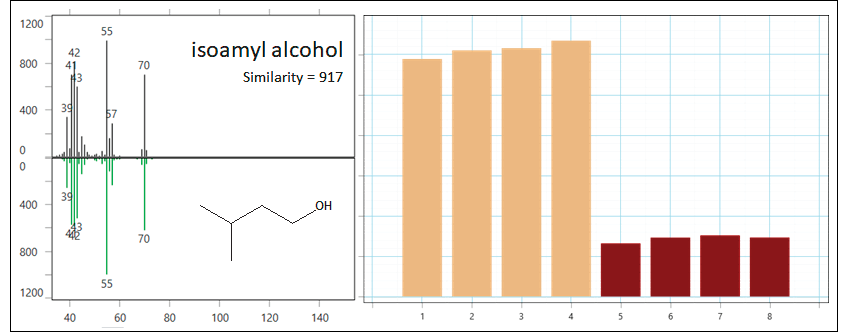
Figure 4. Isoamyl alcohol was determined as a class-distinguishing feature through ChromaTOF Tile. It was identified through spectral and RI matching and is observed at higher levels in the barrel-aged syrup. Image Credit: LECO Corporation
The top spectrum of Figure 4 depicts the observed spectral data, and the library match, with a similarity score of 917, is shown inverted below. A retention index with an observed RI value of 742 compared to the library RI value of 736 also supports the tentative identification.
Isoamyl alcohol is characterized using “fermented” and “whisky” aroma descriptors. The higher levels in the barrel-aged sample are relevant to the aroma profile differences.
Apart from the two features depicted in Figures 2 to 4, ChromaTOF Tile offered information on various other features in the chromatogram that differentiated the samples. The software was used to determine the relative trends between the samples for these features and their tentative identifications.
Then, the overall trends were summarized and described using PCA in ChromaTOF Tile. A total of 139 features found to differentiate the samples and that were also tentatively identified (by similarity score and RI matching, when available) were submitted as variables for PCA.
Only those chemical features that differentiated the groups were chosen as variables, but the scores plot is predicted to depict distinct clusters by group, as illustrated in Figure 5. In fact, virtually all the variation is determined in the first principal component (PC1).
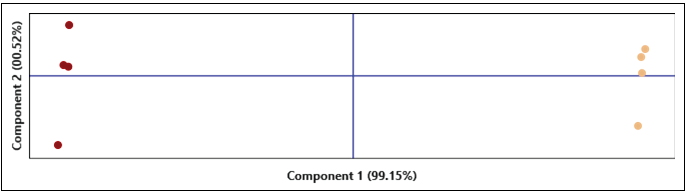
Figure 5. PCA scores plot shows distinct clusters for the barrel-aged syrup (light brown) and the regular syrup (dark brown) with variables that differentiate the samples. Image Credit: LECO Corporation
Figure 6 illustrates an investigation of the loadings that can be quite helpful to unravel the trends (higher in barrel-aged or higher in regular syrup) in the chemical changes.
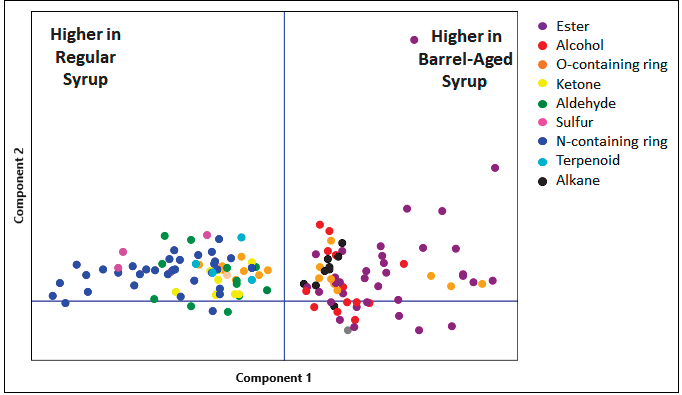
Figure 6. PCA loadings. Different compound classes tend to have different trends (increase or decrease) in the barrel-aged syrup compared to the regular syrup. Image Credit: LECO Corporation
On PC1, the bourbon barrel-aged syrup was found to have positive scores, and the features with positive loadings on PC1 are greater in the barrel-aged syrup. By contrast, the regular syrup was found to have negative scores on PC1, and the features with negative loadings on PC1 are noticed at higher levels in the regular syrup.
Upon color-coding the loadings by compound type, it is evident that the trends (lower or higher in the barrel-aged sample) are highly consistent by functional group.
In the barrel-aged syrup, alkanes, alcohols and esters were constantly seen at higher levels. On the other hand, in the regular syrup, aldehydes, nitrogen-containing rings (pyridines and pyrazines), ketones and sulfur-containing compounds were constantly observed at higher levels.
On a per analyte basis, oxygen-containing rings (furans and substituted furans) were found to be lower or higher in the barrel-aged syrup.
Such a characterization of the samples based on compound class trends helps understand the differences in the syrups. The information on particular individual analytes in these compound classes is also available. Figure 7 shows the representative examples from different compound classes.
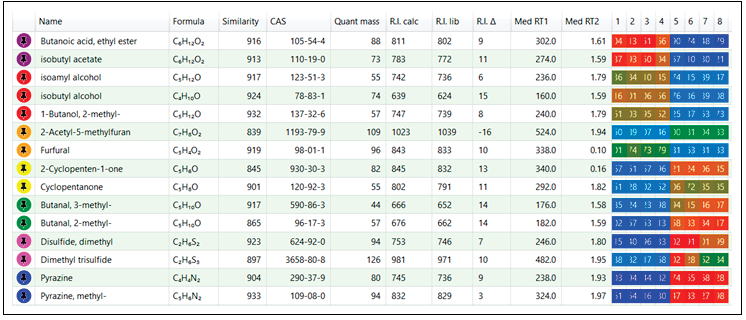
Figure 7. Peak identification metrics (similarity score, RI information) and relative trends (heat map color scale, barrel-aged syrup is columns 1–4 and regular syrup is columns 5–8) are shown for representative analytes from the various compound classes. Image Credit: LECO Corporation
This workflow was enabled by ChromaTOF Tile and quickly revealed the chemical variations between both the syrup types, established the trends and identifications for the particular chemical features related to these differences and unraveled particular functional group trends that may relate to the barrel-aging.
Conclusion
This article has shown that GCxGC paired with TOFMS was advantageous for isolating the complex syrup samples and separating the individual analytes. ChromaTOF Tile enabled the sample class comparison and quickly identified features in the data that distinguished the barrel-aged syrup from the regular syrup.
Identification of the features and characterization of the trends were achieved, denoting constant changes associated with the compound class. The array of tools used here enables this kind of non-targeted differential analysis and allows users to explore more about their samples.

This information has been sourced, reviewed and adapted from materials provided by LECO Corporation.
For more information on this source, please visit LECO Corporation.