Across various industries, different functions necessitate different particle size distributions of ground calcium carbonate powders. This is why particle sizing is a crucial part of the process for the quality control of ground calcium carbonate.
Calcium-Carbonate. Image Credit: Bettersize Instruments
This article looks at the particle size distribution of three different ground calcium carbonates measured by the laser diffraction method. Representative size values and size distribution curves were compared to assess the quality and stability of the sizing process of each of the three samples.
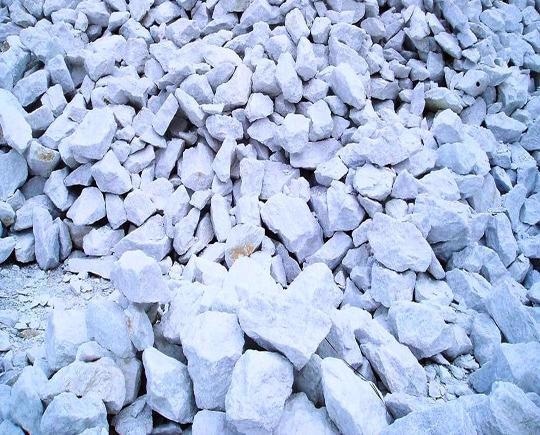
The ground calcium carbonate (GCC) powder is typically manufactured by crushing and grinding natural white calcites, as exhibited in Figure 1.

Figure 1. White calcites and GCC powders. Image Credit: Bettersize Instruments
The GCC powder has various distinct functions over a wide range of industries: it can be utilized as a filler for concrete in the construction industry, blackboard chalk, ceramic tiles, iron ore purification, oil well drilling fluids, paints, adhesives, sealants, and for controlling acidity in the paper industry.
Most of these functions necessitate a variety of specific particle size distributions (PSD) of GCC powders. As a result, routinely measuring PSD is crucial for the quality control process after mining and grinding.
Measuring Particle Size Distribution of Calcium Carbonate Powders
Three GCC powder samples were evaluated using the Bettersizer ST throughout this study. All three samples (GCC samples A, B, and C) were measured after being classified and packed. All measurements were repeated six times to verify repeatability.
The built-in wet dispersion unit of the Bettersizer ST facilitated the dispersal of the GCC samples during the study. The patented dual lens optical systems (DLOS) of the Bettersizer ST delivers a measuring range of 0.1-1000 μm, capable of measuring these GCC powders and several other grades of calcium carbonate.
With the DLOS technology, the Bettersizer ST can offer the user swift, accurate, and extremely repeatable PSD measurement results. These PSD results are necessary to optimize the calcium carbonate products and guarantee that they are compliant with the industry standards and requirements.
PSD Curves Help to Evaluate the Quality of GCC Powders
Throughout the classification and sorting process, prior to being packed and shipped, all three GCC powder samples were sifted using a 325 sieve mesh. This guaranteed that the particle size value of almost all particles in these GCC powder samples would be less than 45 μm, which is the mesh size of the 325 sieve opening.
Bettersizer ST was used to evaluate the particle size distributions and percentiles of GCC powder samples A, B, and C, whose general range of size values are displayed in table 1.
Table 1. Typical size values of GCC samples A, B, and C. Source: Bettersize Instruments
| Sample name |
D10 (µm) |
D50 (µm) |
D90 (µm) |
| GCC Sample A |
2.290 |
16.14 |
35.61 |
| GCC Sample B |
2.289 |
16.07 |
36.54 |
| GCC Sample C |
2.095 |
15.78 |
34.79 |
As stated in table 1, the D90 of Sample A, B, and C is less than 45 μm. That means 90% of the particles in these three samples can be passed through a 325 sieve mesh, which indicates most of the particles in these samples are in compliance with the size requirement.
To assess the size distribution of GCC powder products, the PSD curves of GCC samples A, B, and C were measured and compared. The results are displayed in figure 2.

Figure 2. PSD curves of GCC samples A, B, and C. Image Credit: Bettersize Instruments
As shown in figure 2, three GCC powder samples are comparable in size distribution mode and range. This is an indication that the quality of these calcium carbonate products is controlled in terms of particle size.
The slightly smaller size of the GCC sample C suggests there are fewer coarse particles in sample C. Yet, overall, the PSD results of the three GCC powder products are stable.
Sizing Results from Bettersizer ST with High Repeatability
To ensure repeatability PSD, measurements of every sample were repeated six times. The results of the characteristic size values of GCC powder sample C are shown in table 2.
According to table 2, repeatability errors of measurement results are minute and are in compliance with ISO 13320 standard. This indicates that the Bettersizer ST is good for producing repeatable and reproducible sizing results.
Table 2. Typical size value of GCC powder sample C. Source: Bettersize Instruments
| Record number |
D10 (µm) |
D50 (µm) |
D90 (µm) |
| Sample C-1 |
2.097 |
15.70 |
34.92 |
| Sample C-2 |
2.097 |
15.70 |
34.87 |
| Sample C-3 |
2.089 |
15.66 |
34.83 |
| Sample C-4 |
2.106 |
15.95 |
34.75 |
| Sample C-5 |
2.106 |
15.95 |
34.71 |
| Sample C-6 |
2.095 |
15.87 |
34.68 |
| Repeatability error |
0.32% |
0.85% |
0.25% |
| Average |
2.095 |
15.78 |
34.79 |
Conclusions
Requirements of particle size and size distributions of GCC powder products fluctuate over a broad range, depending on the application. Good control of the PSD of GCC powder products is crucial for both GCC producers and their customers.
The Bettersizer ST is an effective and dependable instrument that offers particle sizing solutions to the product quality control process of most mining industries, as well as delivering incoming quality control of GCC powder for a majority of industrial applications.
Its sensitivity in identifying minor differences between samples A, B and C gives user confidence when evaluating the production process and diagnosing the reason for small or large variations in particle size distribution.

This information has been sourced, reviewed, and adapted from materials provided by Bettersize Instruments.
For more information on this source, please visit Bettersize Instruments.
