Simultaneous, low-dose imaging is delivered by the K3® IS camera via real-time electron counting, a large field of view and fast continuous data capture.
Graphene, along with other 2D materials, has been increasingly studied over the last few years for its unique and tunable properties.
Due to its extreme sensitivity to electron beam irradiation, graphene is typically only studied at a maximum of 80 kV accelerating voltages. It is, therefore, more challenging to observe graphene at the atomic scale using a transmission electron microscope (TEM) due to this low accelerating voltage without using a monochromator or aberration correction.
It may instead be possible to use lower dose rates to observe graphene and other 2D materials, though it is important to note that these are restricted by the inherently low contrast of single-layer graphene.
Methods and Materials
An uncorrected JEOL F200 with a cold field emission gun was the TEM used to capture the data, operating at 200 kV. A K3 IS camera in counted mode, a dose rate of 23.29 e- /pix/s, and 2,736 e- /Å2/s on the sample were used to collect images. Each pixel measures at just 0.09 Å.
As evidenced by Figure 1, the image depicted used a 5-second exposure time, a sum of 150 counted images aligned post-acquisition. These 150 counted images were produced during acquisition from the original 7500 counted frames from the sensor. After acquisition, the data was binned by 2 to produce the 2880 x 2046-pixel image.
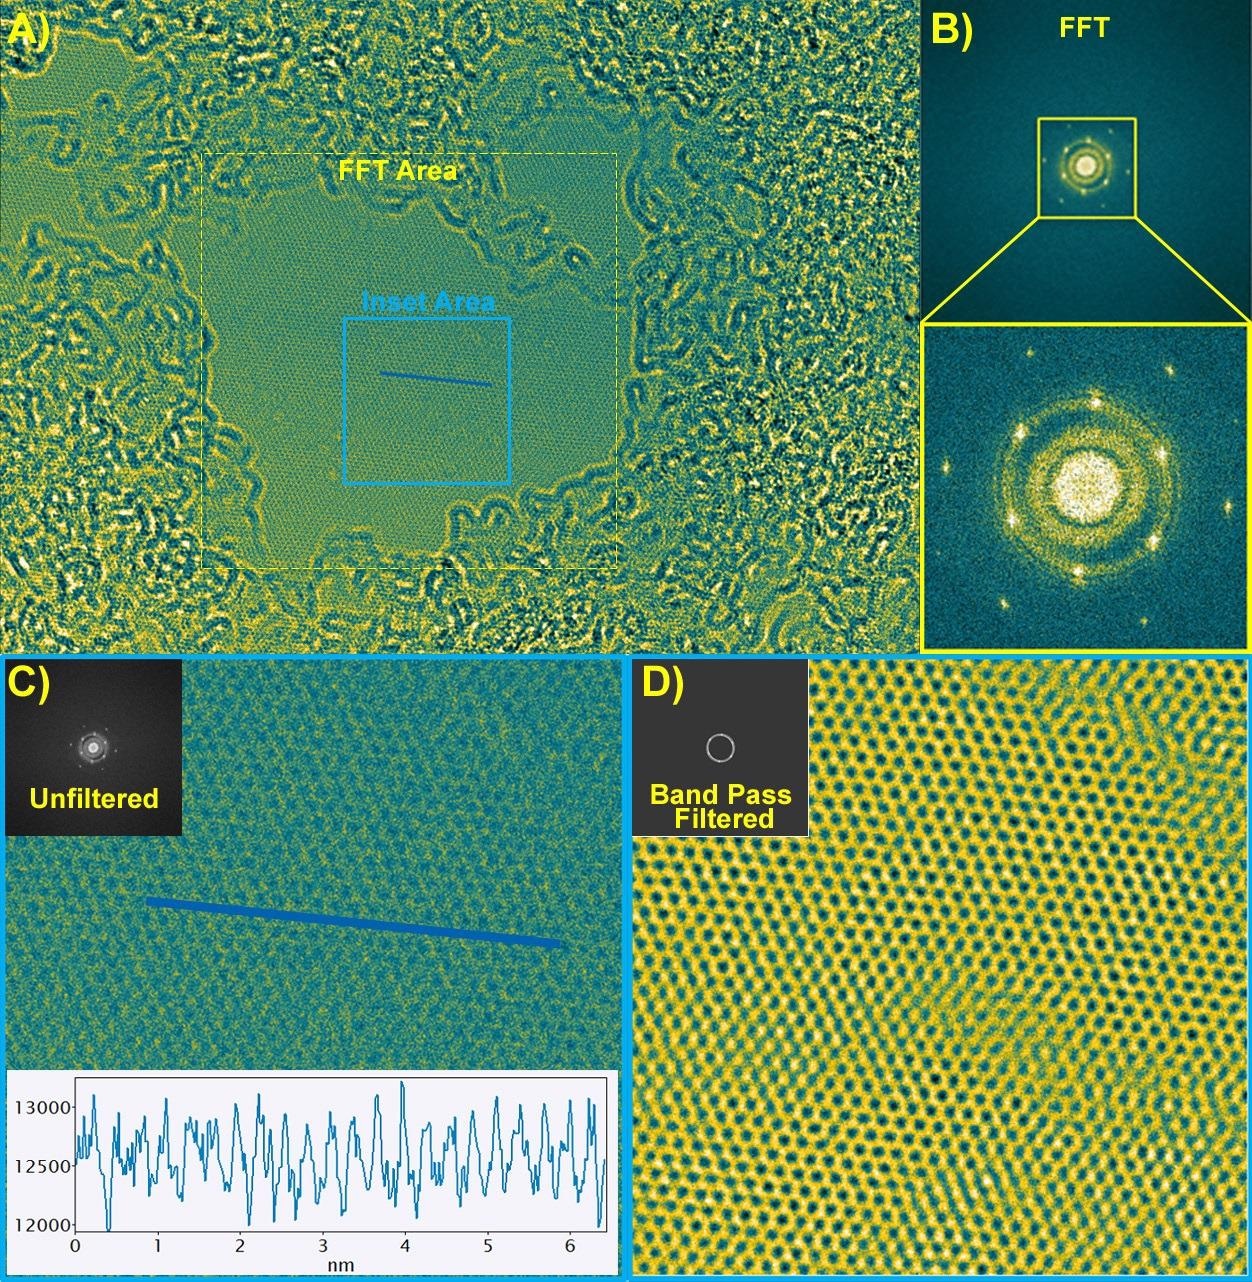
Figure 1. Graphene imaged at 200 kV. A) The full image area, with yellow and blue boxes showing where data was taken for B-D. B) Full FFT and zoomed central region of FFT showing 2 sets of 6 spots from the graphene sample. C) Magnified view of the region inside the blue box in A, the corresponding FFT, and a profile summed over 7 pixels from the location indicated by the blue line. D) The same region as C, but with a bandpass filter applied, as shown in the FFT. Image Credit: Gatan Inc.
Summary
Even at 200kV, low dose imagining using the counted mode of the K3 camera-enabled TEM imaging of single-layer graphene. The min-to-max contrast in the single-layer region is only about 10% of the mean intensity, as seen in the profile of Figure 1C.
Despite the good signal-to-noise performance of the camera and the sufficient resolution offered by the microscope, it can still be challenging to image defects in the graphene single layer. Nonetheless, bandpass filtering can still be used to draw out features that deviate from the perfect lattice.
Gatan, Inc. is the leading global manufacturer of instrumentation and software used to improve and extend the range of electron microscopes — from specimen preparation and manipulation to imaging and analysis.

This information has been sourced, reviewed and adapted from materials provided by Gatan Inc.
For more information on this source, please visit Gatan Inc.