Sponsored by Gatan, Inc.Reviewed by Olivia FrostDec 3 2025
Identifying hydrogen and hydride phases can be difficult using traditional microanalysis methods. Because of its atomic structure, hydrogen does not release distinctive X-rays when exposed to electrons or X-rays. As a result, it cannot be detected by energy-dispersive spectroscopy (EDS) or wavelength-dispersive spectroscopy (WDS).
Electron backscatter diffraction (EBSD) can reveal the crystal structure of a putative hydride phase, but it cannot confirm the presence of hydrogen or rule out other phases with comparable crystal structures. In titanium alloys, the hydrogen and hydride phases can cause hydrogen embrittlement and hydride-induced cracking.
As a result, it is crucial to accurately determine the presence and position of hydrogen and hydrides within the titanium alloy microstructure.
To overcome this issue, Gatan has developed the Cipher® system, which utilizes quantitative backscatter electron (qBSE) imaging and EDS to detect the presence of hydrogen via a composition-by-difference method. EBSD data support these findings.
Materials and Methods
A titanium alloy with a putative hydride phase was created and briefly cleaned utilizing a PECS™ II system for 30 minutes at 2 kV ion beam energy and a 4° incidence angle. Cipher analysis was conducted at 10 kV. Secondary and backscatter electron images were obtained simultaneously for Cipher analytical purposes.
The backscattered electron image was captured with the OnPoint™ BSE detector. The qBSE image was then transformed to a mean atomic number map. EDS data was collected with an EDAX® Octane Elite Super detector. The eZAF model was then used to calculate the quantitative elemental makeup of the non-hydrogen elements.
The qBSE and EDS data were then linked, and the hydrogen concentration was calculated using the Cipher technique. Figure 1 shows the hydrogen atomic percentage map generated by the Cipher system. Line scan examination of the hydrated region shows a mean hydrogen atomic percentage of 52.5 %.
An EDAX Velocity™ Ultra detector operating at 20 kV was used to capture EBSD data from the same location. The acquired EBSD patterns were processed with spherical indexing in the EDAX OIM Matrix™ module. Based on the measured composition and TiH phase diagram analysis, the alpha HCP titanium and FCC TiH phases were chosen for examination.
Figure 2 shows the EBSD phase map. Comparing the Cipher and EBSD images reveals a strong correlation in the identification and spatial distribution of the hydride areas, demonstrating that Cipher accurately assesses the presence of hydrogen in the material.
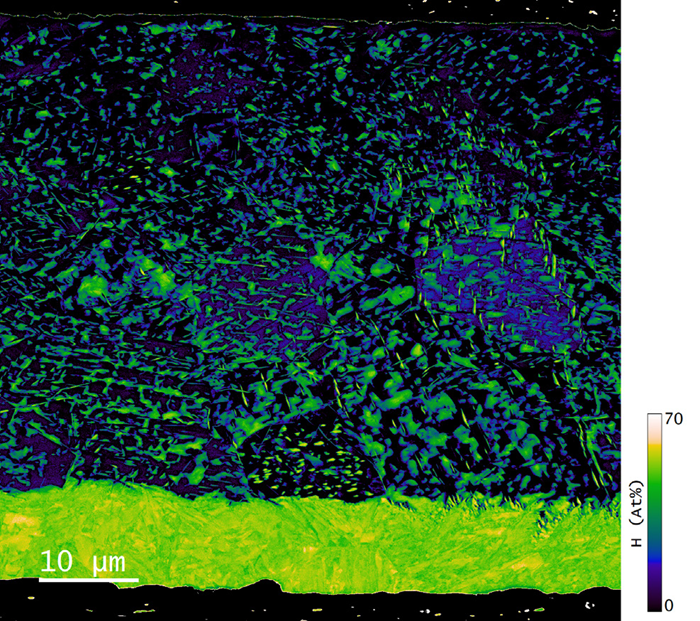
Figure 1. The hydrogen atomic percentage map derived using the Cipher system. Image Credit: Gatan, Inc.
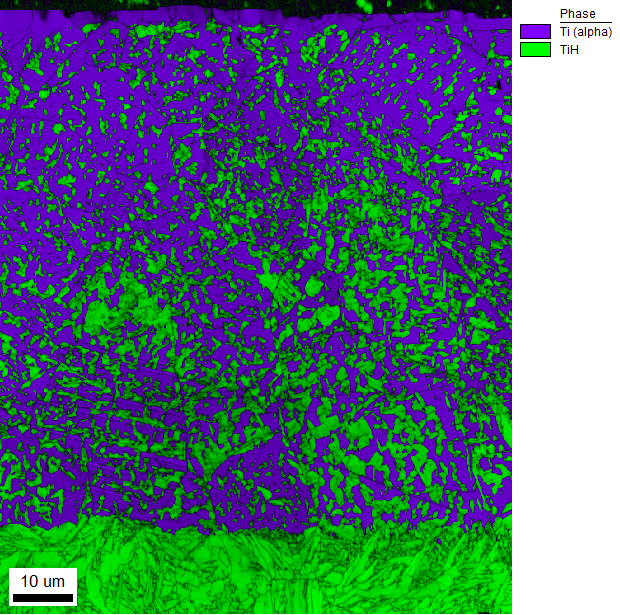
Figure 2. EBSD phase map showing the Tia (blue) and TiH (green) phases. Image Credit: Gatan, Inc.
Summary
The Cipher system uses the OnPoint BSE detector for imaging and the EDAX Octane Elite Super EDS detector for elemental analysis to determine the presence and composition of hydrogen and hydride phases in titanium microstructures.
EBSD can corroborate these results by identifying and distinguishing between distinct crystallographic phases. Combining all of these techniques results in a full characterization of this microstructure.

This information has been sourced, reviewed and adapted from materials provided by Gatan, Inc.
For more information on this source, please visit Gatan, Inc.