PC/ABS plastics integrate the respective benefits of ABS and polycarbonate (PC). It is workable, shock resistant and heat resistant and is utilized for office machines and automotive interior components. Along with this, it is commonly used for electronic parts because it is an excellent insulation material.
With amorphous plastics like PC/ABS plastics, thermal characteristics, for example, the specific heat, thermal conductivity and linear expansion coefficient have an inflection point at the glass transition temperature.
It is critical when injection molding to evaluate the glass transition temperature as a reference to the solidification temperature.
Samples were initially molded with ABS plastic and PC plastic blend ratios ranging from 0% to 100% in intervals of 25%. To assess the relationship between the glass transition temperature and the sample blend, a differential scanning calorimeter was utilized to measure the glass transition temperature.
A Fourier transform infrared spectrophotometer was used to investigate the conformity between the composition ratio after molding and the conformity between the blend ratio prior to molding.
This article presents an example of the comparison and evaluation of samples with the use of these two instruments.
User Benefits
- It is simple to quantify the glass transition temperature necessary to mold amorphous plastics using DSC
- The PC blend ratio can be used to estimate the glass transition temperature
- After molding PC/ABS plastic, the composition ratio can be validated
Measurement Samples
Table 1 depicts the blend ratios of PC/ABS plastics utilized in the measurements, and Figure 1 includes photos of samples No. (1), (3) and (5).
Table 1. List of Measurement Samples. Source: Shimadzu Scientific Instruments
| Sample No. |
PC/ABS Blend Ratio |
| (1) |
PC 100 %, ABS 0 % |
| (2) |
PC 75 %, ABS 25 % |
| (3) |
PC 50 %, ABS 50 % |
| (4) |
PC 25 %, ABS 75 % |
| (5) |
PC 0 %, ABS 100 % |
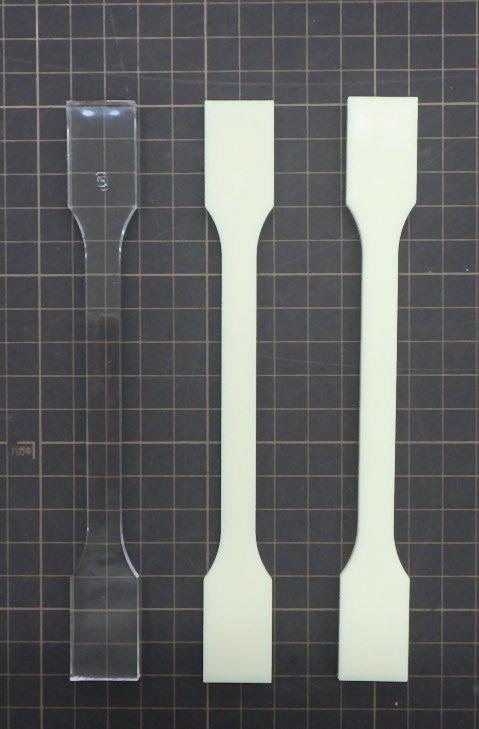
Figure 1. Appearance of Samples. Image Credit: Shimadzu Scientific Instruments
Sampling and Measurement Conditions
As illustrated in Figure 2, the samples were finely cut up and deposited into an aluminum crimp cell. The DSC-60 Plus, pictured in Figure 3, was used to perform the measurements utilizing the measurement conditions outlined in Table 2.
Table 2. Measurement Conditions. Source: Shimadzu Scientific Instruments
| . |
. |
| Differential Scanning Calorimeter: |
DSC-60 Plus |
| Electric Cooler: |
TAC-60i |
| Heating Rate: |
20 °C/minute |
| Temperature Range: |
0 to 200 °C |
| Sample Weight: |
8 mg |
| Atmosphere: |
Nitrogen |
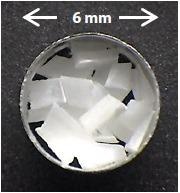
Figure 2. Sampling. Image Credit: Shimadzu Scientific Instruments
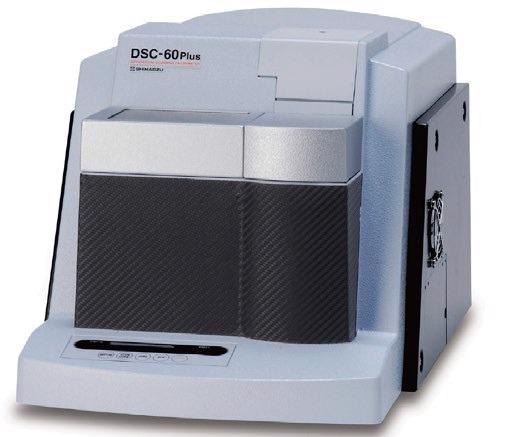
Figure 3. DSC-60 Plus. Image Credit: Shimadzu Scientific Instruments
Measurement Results for PC/ABS Plastics
Figure 4 demonstrates the measurement results from the DSC-60 Plus differential scanning calorimeter. With the PC/ABS plastic, Tg1, the glass transition temperature for ABS plastic, and Tg2, the glass transition temperature for PC plastic, were identified. Both Tg1 and Tg2 varied according to the blend ratio.
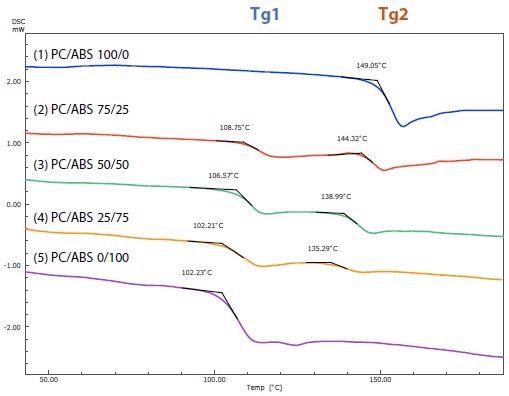
Figure 4. DSC Curves for Sample No. (1) to (5). Image Credit: Shimadzu Scientific Instruments
Figure 5 shows the connection between the glass transition temperature and the PC blend ratio. With respect to the blend ratio for both Tg1 and Tg2, the relationship was largely linear. From this data, the glass transition temperature for PC plastic could be predicted using the blend ratio.
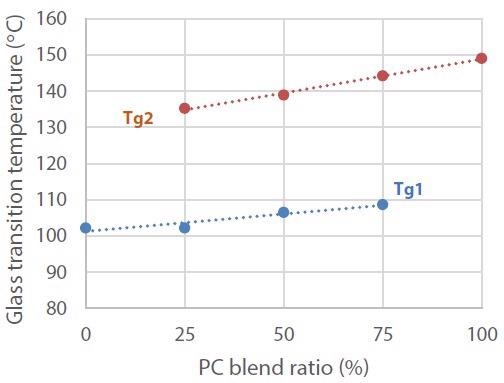
Figure 5. Relationship between the PC Blend Ratio. Image Credit: Shimadzu Scientific Instruments
It is considered that this will support the identification of the correct molding temperature, along with evaluating the inflection points for the specific heat and thermal expansion coefficient, which are thermal features of the molded products.
For injection molding, measurements were carried out utilizing the IRTracer™-100 to confirm the composition ratio after molding because the blend ratio of materials injected into the molding machine does not always match the composition ratio post-molding.
Figure 6 presents enlargements of the IR spectra in the vicinity of 1770 cm-1 for PC/ABS plastics.
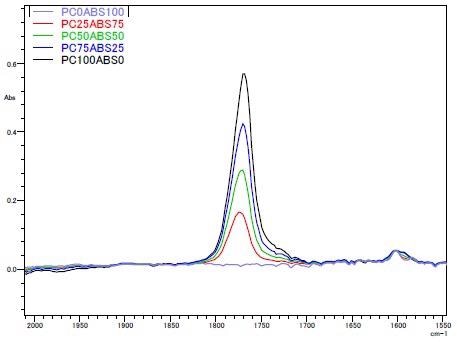
Figure 6. Enlargements of the IR Spectra in the Vicinity of 1770 cm-1. Image Credit: Shimadzu Scientific Instruments
It was found that the peak intensity increased as the PC blend ratio increased due to C=O stretching vibration in the vicinity of 1770 cm-1. It is known that the peak intensity correlates to the material’s PC blend ratio.
Figure 7 shows the relationship between the peak intensity and the PC blend ratio.
A linear graph was acquired, so it could be validated that for the different samples after molding, the ABS plastic and PC plastic were molded with the proper composition ratio at 25% intervals.
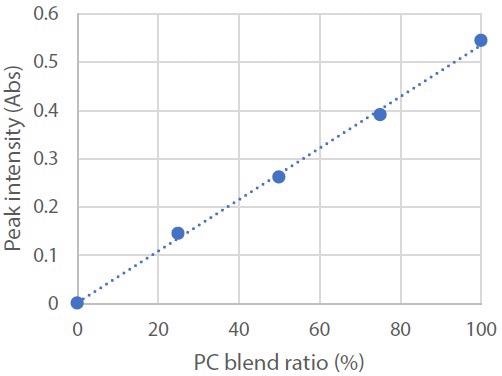
Figure 7. Relationship between the PC Blend Ratio and Peak Intensity. Image Credit: Shimadzu Scientific Instruments
Conclusion
A Fourier transform infrared spectrophotometer and a differential scanning calorimeter was used to assess molded PC/ABS plastics with varying PC/ABS blend ratios.
The relationship between the glass transition temperature and PC blend ratio was evaluated, and the composition ratio after molding was established.
Acknowledgments
Produced from materials originally authored by A. Naganishi from Shimadzu Scientific Instruments Incorporated

This information has been sourced, reviewed and adapted from materials provided by Shimadzu Scientific Instruments.
For more information on this source, please visit Shimadzu Scientific Instruments.