Additive manufacturing (AM) processes can be employed in the precise manufacture of extremely complex components.
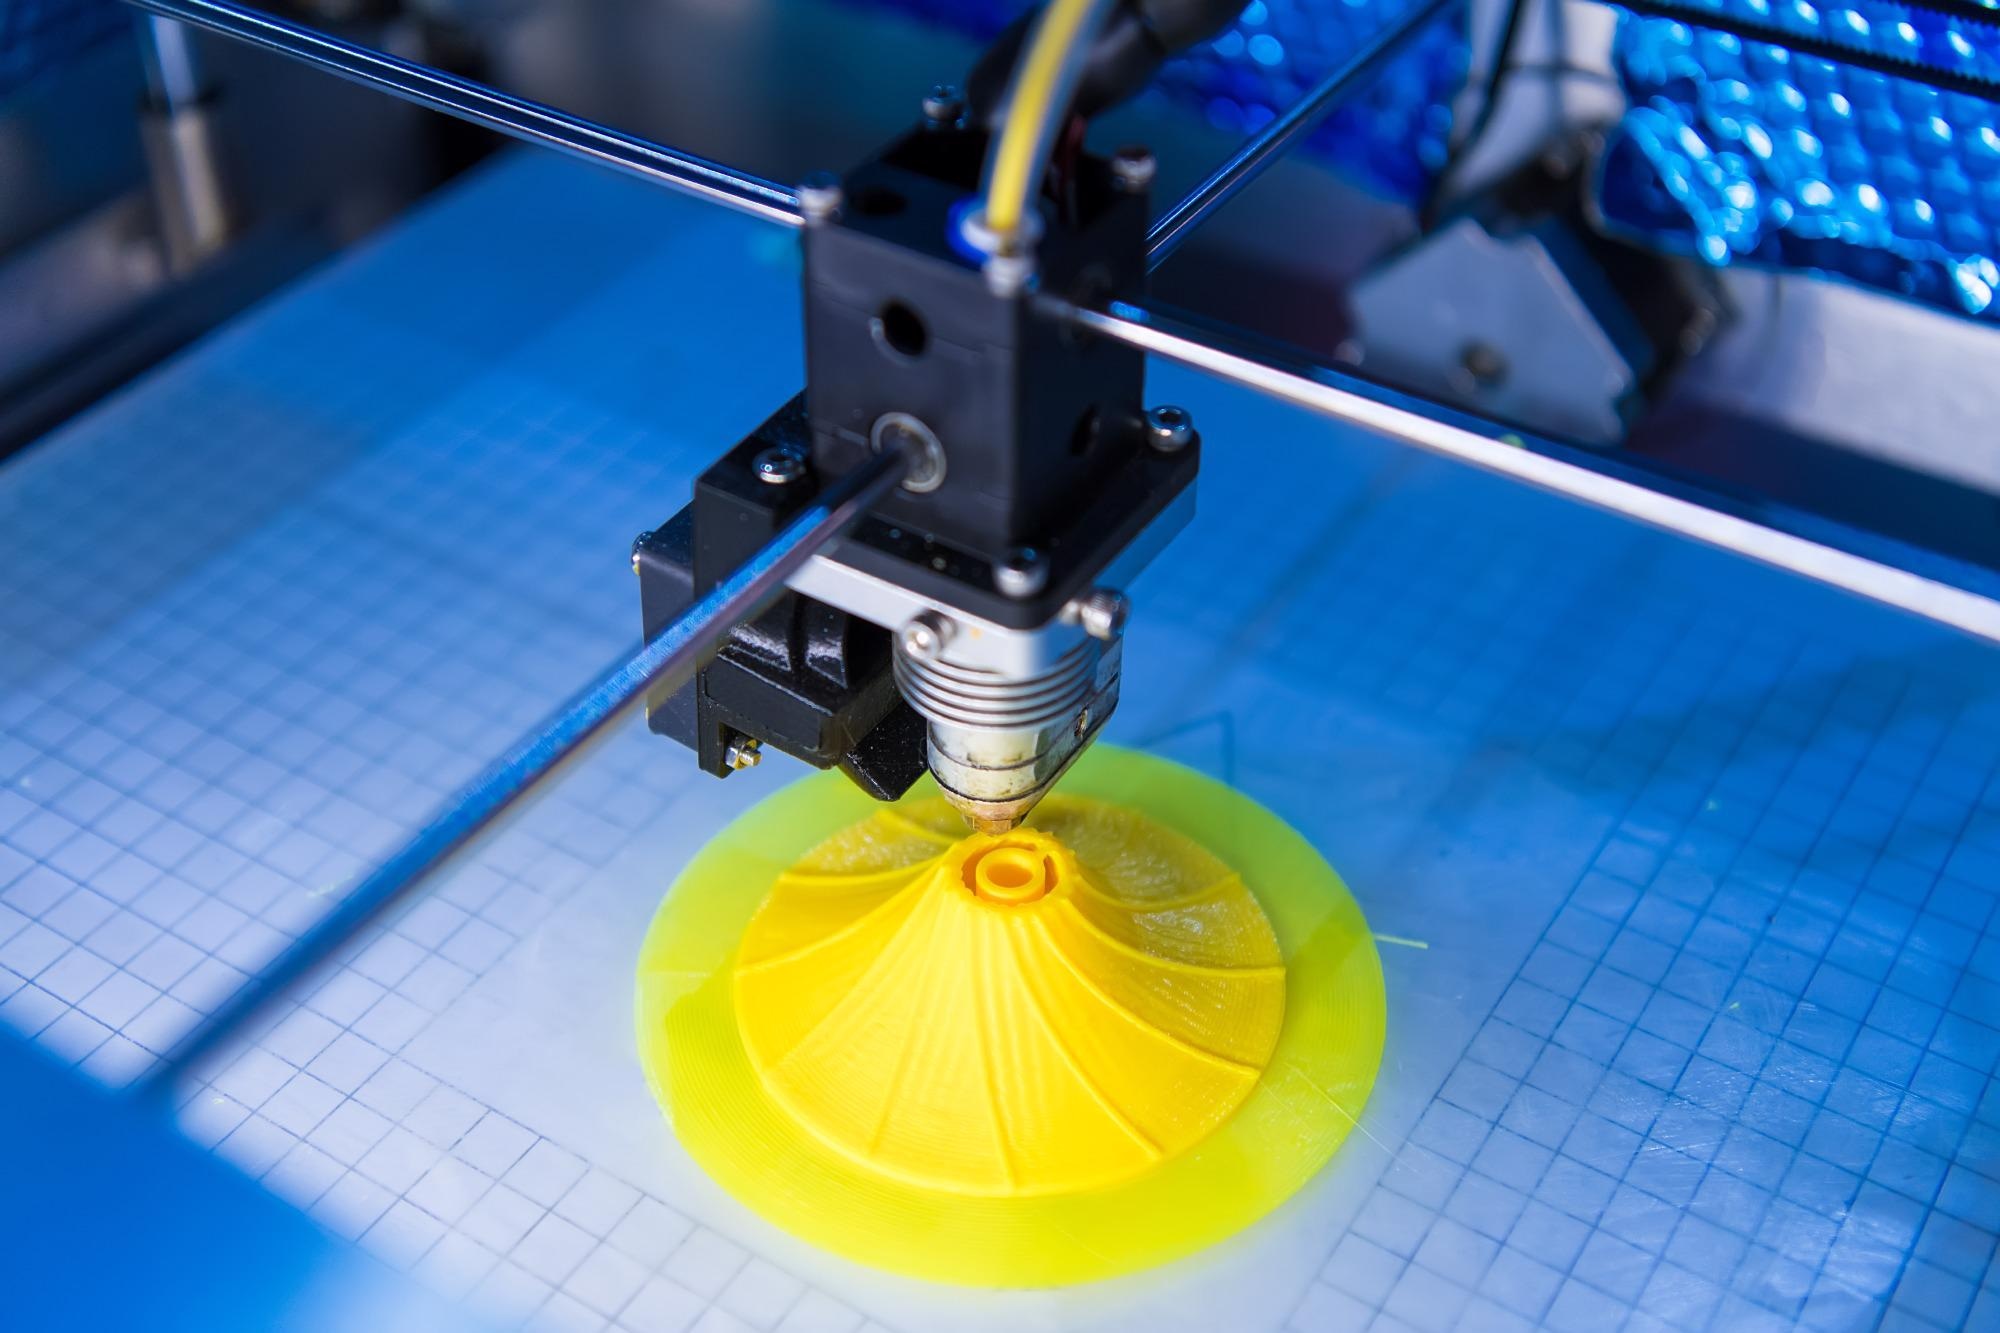
Image Credit: Bettersize Instruments
The process is also customizable and, compared to traditional production processes, in which components are manufactured by removing excess material (top-down approach, e.g., turning, milling, grinding), additive manufacturing employs the so-called bottom-up approach.
As such, the workpieces are constructed three-dimensionally, layer-by-layer. This can be achieved in a variety of ways, such as extrusion and deposition of heated polymers, selective melting or sintering of a powder using laser or electron beams, or selective curing of photoactive polymers.
Irrespective of the chosen method, additive manufacturing can be employed to realize almost impossible structures that cannot be made using conventional material removal processes. Another significant advantage of AM processes lies in the short manufacturing chain between digital design and finished workpieces.1
The information required for the manufacture of a specific workpiece is imported into the machines as a digital file. This means that the same component can be manufactured at various locations without any problems, even with strict specifications, since only the digital information on the workpiece, the production machine and the raw material are necessary.
This erases the need for entire supply chains of, for instance, preliminary stages or finished workpieces, which boosts time efficiency and results in more cost-effective production. The final product properties of workpieces produced by means of additive manufacturing are fundamentally influenced by the starting material and its powder properties.2
The key characteristics are particle size distribution,3 particle shape,3,4 chemical composition,5-6 flowability,7 powder layer density (PLD)8,9 and internal porosity.3
However, there is a lack of quantified or specified and widely recognized parameters for characterizing powder properties for use in additive manufacturing,4 or they remain under lock-and-key by powder manufacturers for competitive reasons.2
Thus, effective monitoring of raw material quality is crucial for additive manufacturing to guarantee consistent product properties.
Another intriguing correlation between the influence of powder characteristics on the final properties of the workpiece created, for instance, by laser beam melting (LBM - Laser Beam Melting/SLM - Selective Laser Melting) emerges from the question of whether or not the powder fed into the process but not melted must be disposed of or reused for later production.10
Since the production volume of components manufactured by laser melting is ever-increasing,11 and most of the powder used (95-97 %)12 is not melted, this question should be addressed from both economic and ecological aspects.
Throughout the LBM process, so-called spatter particles are created, which are deposited in the powder bed and the production zone of the LBM machine and thus amass in the recycling powder.13
It also has to be established that a higher energy density of the laser radiation employed produces an increase in spatter particle formation.14,15
While further investigation into the influence of the spatter particles on the final product quality of the manufactured workpiece needs to be conducted, the evaluation of the particle size distribution and particle shape of the fresh powder compared to the spatter particles is a key approach.10
As well as the traditional method of laser diffraction (static laser light scattering) for establishing particle size distribution, an imaging method is necessary for the acquisition of the shape factors of particle collectives, particularly those of single particles.
Contextually, dynamic image analysis is well-suited for providing statistics and thus a representative analysis of the mean particle shape parameters of the whole collective due to the high-speed capture of a great number of individual particles.
Additionally, single-particle acquisition facilitates the detection and evaluation of statistically underrepresented oversized particles or fractions of heterogeneous powder samples relative to size and/or shape.
The Bettersizer S3 Plus (Figure 1) is a measuring instrument with the unique ability to effectively analyze particle size distribution from the nano to the millimeter range by means of traditional laser diffraction and the synchronous characterization of particle shape as well as oversize and agglomeration phenomena by way of dynamic image analysis.
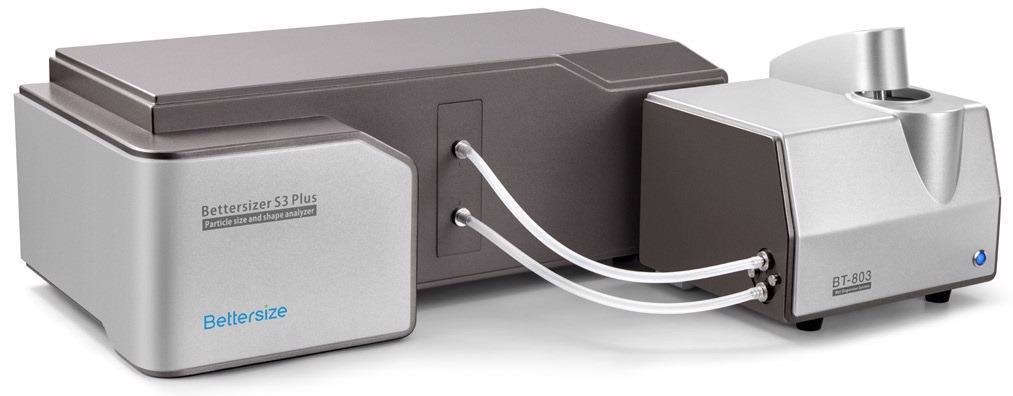
Figure 1. Bettersizer S3 Plus: A combination of laser diffraction and dynamic image analysis. Image Credit: Bettersize Instruments
The Bettersizer S3 Plus: One Instrument, Two Essential Powder Properties
Figure 2 displays the optical unit of the Bettersizer S3 Plus: the wet measuring cell is positioned in the center of the main platform, two Fourier lenses are situated directly to the right and left of the cell (two Fourier lenses = dual-lens technology).
To the right of the measuring cell is the laser light source positioned at an angle (green DPSS laser, wavelength = 532 nm), and the CCD camera system (two cameras with different lenses: 0.5x and 10x) and the backscattering detectors are located perpendicular to the measuring cell.
To the left of the measuring cell, the detector system for detecting forward and side scattering is in place.
This unique setup facilitates:
- The precise measurement of extremely small particles (from 10 nm) utilizing the double lens method (static laser light scattering, see section 2.1).
- The highest measuring precision for extremely coarse particles (up to 3.5 mm) is optionally supported by the 0.5x CCD camera (static laser light scattering in combination with dynamic image analysis).
- Oversized particle analysis, particle shape determination and agglomerate check with the 0.5x and/or 10x CCD camera (dynamic image analysis).
Laser Diffraction/Static Laser Light Scattering with the Innovative Double Lens Technique (DLOI System)
Figure 2 displays the schematic diagram of the Bettersizer S3 Plus: the unique feature of this laser setup is the DLOI System (= Dual Lenses & Oblique Incidence System). The arrangement of the laser is inclined to the measuring cuvette to enable the widest possible scattering angle range of the lateral front detectors.
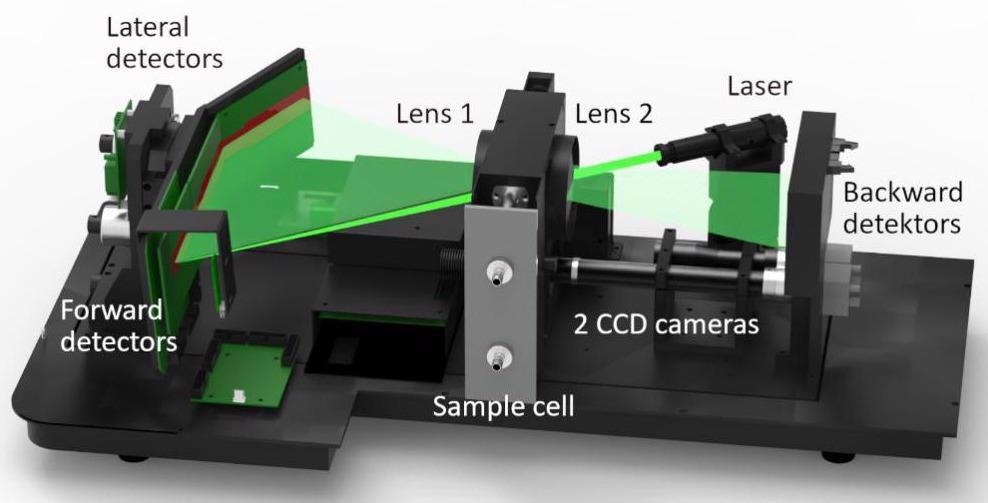
Figure 2. Setup of the Bettersizer S3 Plus incl. dual lens system with DLOI S (Dual Lenses & Oblique Incidence System) technology and CCD camera unit (0.5x and 10x). Image Credit: Bettersize Instruments
Fourier Lens 2 generates an exact parallel laser beam that encroaches on the sample. The scattered light is focused into the detector plane by Lens 1 in line with the known Fourier setup; thus, the scattering particles in the cuvette do not necessarily have to be positioned in one plane - a significant advantage over the traditional reverse Fourier setup.16
In turn, Lens 2 facilitates focusing and thus detection of the backscattered radiation, generating an extremely large angular range (0.02 - 165°) with superior detector resolution compared to other systems on the market.
In particular, a high scattered light resolution in the backscattering range (> 90°) is vital for the precise detection of extremely small particles (< approx. 500 nm).16
The exceptionally wide angular coverage also has the benefit of a second, shorter-wavelength laser. Accordingly, no scattering spectra of mixed wavelengths are measured, which is beneficial as the evaluation of those spectra is not allowed using the frequently used models (Fraunhofer and Mie).
Dynamic Image Analysis For Particle Shape Analysis
Subject to the sample’s distribution range, the two high-speed CCD cameras of the Bettersizer S3 Plus can be either used individually or in combination for comprehensive particle size and shape analysis based solely on dynamic image analysis.
The appropriate size range is:
- 30 – 3,500 μm for the 0.5x camera
- 2 – 50μm for the 10x camera
Several thousand to 100,000 particles can be recorded per minute with both cameras, but this is contingent on the particle size and sample concentration. For exceptionally broad distributions, the combined use of both cameras is advised.
Throughout the analysis, each singular particle is captured in real-time, stored as an image, numbered and evaluated statistically.17
In addition to various corresponding diameters (e.g., area, perimeter, maximum and minimum Feret), particular shape parameters including aspect ratio, length L/ width D, circularity (roundness), convexity, perimeter and many more are calculated.18
In the case of extremely shape-anisotropic particles, including fibers or platelets, this is a distinct advantage over traditional, “pure” laser diffraction, which makes the assumption spherical particles are present throughout the evaluation.
Additionally, the degree of agglomeration of the systems can be evaluated, and special tasks such as oversize particle analysis can be conducted. Establishing the various equivalent diameters also offers the potential to compare with alternative methods for size determination, such as sieving, and to validate their measurement results.
Application Example: The Particulate Properties of a Fresh Alsi10mg Powder Compared to the Powder Recovered After the LBM Process
Two different AlSi10Mg samples were evaluated with regard to their particle size distribution and particle shape to better illustrate the benefits of the Bettersizer S3 Plus for the quality assessment of powder samples for additive manufacturing using an application-related example.
The sample AlSi10Mg was a fresh powder delivered by the supplier. This was introduced into an SLM manufacturing machine. Once the production step was complete, the sample AlSi10Mg spatter particles were recovered from the fabrication zone of the SLM machine.
Both powder samples were separately dispersed in ethanol and characterized using the Bettersizer S3 Plus regarding the particle size distribution by conventional laser diffraction and particle shape by dynamic image analysis.
In doing so, the powder samples were subsequently introduced to the ethanol-filled dispersion unit of the Bettersizer S3 Plus and pretreated using the device’s internal ultrasonic dispersion for one minute before measurement.
Table 1 illustrates the characteristic diameters of the volume-based particle size distributions acquired using laser diffraction. In Figure 3, the superimposed distribution functions are displayed in the form of graphic histograms and cumulative curves.
Table 1. Characteristic diameters of the volume-based particle size distributions of the investigated samples obtained by laser diffraction. Source: Bettersize Instruments
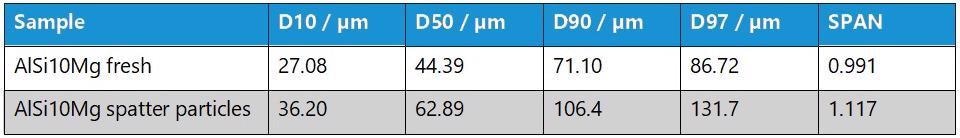
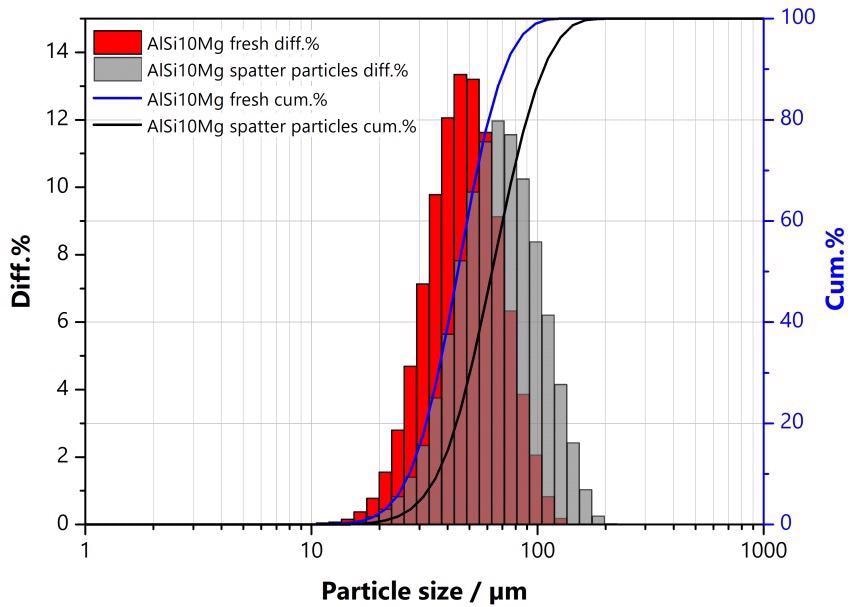
Figure 3. Superposition of the volume-based particle size distributions of the investigated samples obtained by laser diffraction. Image Credit: Bettersize Instruments
Clearly, the spatter particles demonstrate a coarser particle size distribution when compared to the fresh AlSi10Mg sample, as reflected in the measurement results of the laser diffraction experiments.
Similarly, from the SPAN values established (=(D90-D10)/D50), it is apparent that the AlSi10Mg spatter particles have a wider distribution than AlSi10Mg fresh.
For assessing the particle shape, a representative number of singular particles were recorded from both samples with the rapid CCD cameras of the Bettersizer S3 Plus and were analyzed with respect to the number-based ISO shape parameters, circularity and aspect ratio.
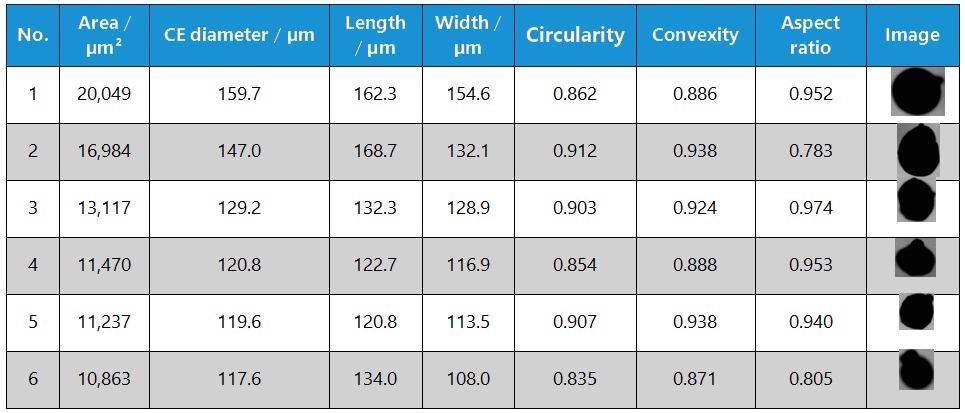
The typical values of the distribution functions of both shape parameters are outlined in Table 2 and projected into Figures 4 and 5. Tables 3 and 4 highlight selected individual particle parameters of the six largest particles identified using the 10x camera of the Bettersizer S3 Plus and show their appearance.
Table 2. Characteristic % values of the number-based particle shape distributions of the investigated samples obtained by dynamic image analysis. Source: Bettersize Instruments
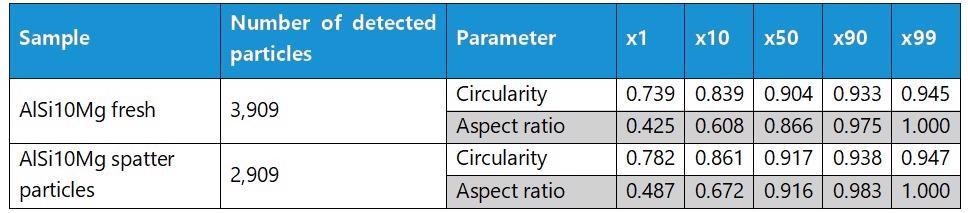
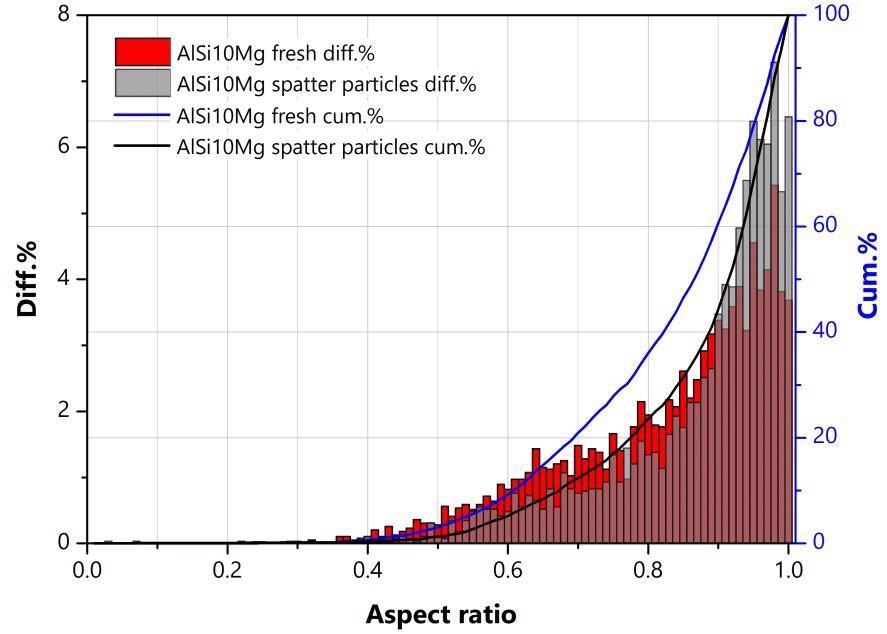
Figure 4. Superposition of the number-based distribution functions of the aspect ratio of the studied samples. Image Credit: Bettersize Instruments
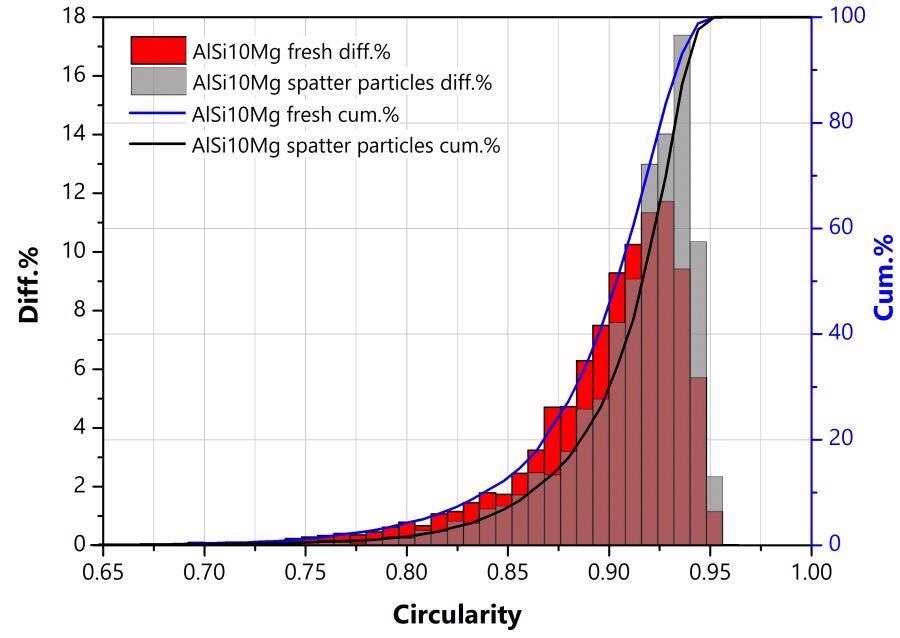
Figure 5. Superposition of the number-based distribution functions of the circularity of the studied samples. Image Credit: Bettersize Instruments
Table 3. Selected single particle parameters of the 6 largest particles of the sample AlSi10Mg fresh detected by the 10x camera. Source: Bettersize Instruments
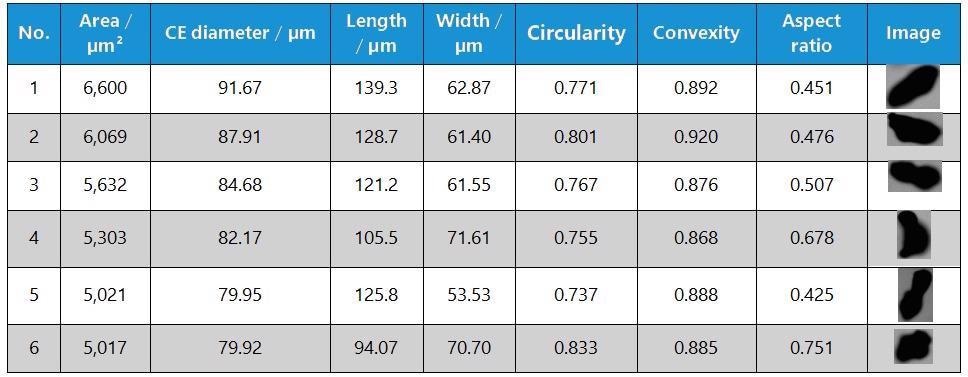
Table 4. Selected single particle parameters of the 6 largest particles of the sample AlSi10Mg spatter particles detected by the 10x camera. Source: Bettersize Instruments
The dynamic image analyses results on both samples, as well as their relative contrast, demonstrates a considerably larger aspect ratio and thereby a lower average expansion of the spatter particles (sample AlSi10Mg spatter particles) in comparison with the particles of the unused powder sample AlSi10Mg fresh.
Similarly, the spatter particles demonstrate greater mean circularity and are thereby characterized by reduced shape anisotropy (resp. higher sphericity) compared to the particles prior to application in the AM process.
Summary and Conclusion
On the basis of the investigations performed using the Bettersizer S3 Plus, both samples analyzed in terms of particle size and shape can be easily identified from one another.
The findings that the spatter particles recovered once the additive manufacturing process is complete are characterized by a coarser and more broadly distributed particle size and higher sphericity in contrast to the fresh AlSi10Mg particles are in accordance with observations from the literature.10
This demonstrates that the Bettersizer S3 Plus is ideally suited for conducting quality control evaluations of raw materials for additive manufacturing processes and offers a significant contribution to a more complete understanding of the impact on the final product properties of the workpieces created using additive manufacturing from a research and development perspective.
This is, in effect, due to the novel combination of the laser diffraction and dynamic image analysis measurement methods in a single measuring device. This facilitates rapid, simple and cost-efficient analysis of the powder raw materials.
For the complete answer to the question of whether it is appropriate to reuse recovered powders in additive manufacturing or whether they must be subjected to additional preparative steps (purification, sieving, mixing with fresh powder), further investigations are still needed.
However, it is known that the chemical analysis of the alloy composition and an evaluation of the quality of workpieces produced using recovered powder are critical.
References:
- J. A. Slotwinski, E. J. Garboczi, P. E. Stutzman, C. F. Ferraris, S. S. Watson und M. A. Peltz, „Characterization of Metal Powders Used for Additive Manufacturing,“ Journal of Research of the National Institute of Standards and Technology, Bd. 119, p. 460, 2014.
- L. Haferkamp, L. Haudenschild, A. Spierings, K. Wegener, K. Riener, S. Ziegelmeier und G. J. Leichtfried, The Infuence of Particle Shape, Powder Flowability, and Powder Layer Density on Part Density in Laser Powder Bed Fusion,“ Metals, Bd. 11, Nr. 3, p. 418, 2021.
- W. J. Sames, F. A. List, S. Pannala, R. R. Dehoff und S. S. Babu, „The metallurgy and processing science of metal additive manufacturing,“ Int. Mater. Rev., Bd. 61, p. 315, 2016.
- J. H. Tan, W. L. Wong und K. W. Dalgarno, „An overview of powder granulometry on feedstock and part performance in the selective laser melting process,“ Addit. Manuf., Bd. 18, p. 228, 2017.
- R. Engeli, T. Etter, S. Hövel und K. Wegener, „Processability of different IN738LC powder batches by selective laser melting,“ J. Mater. Process. Technol., Bd. 229, p. 484, 2016.
- J. A. Slotwinski und E. J. Garboczi, „Metrology Needs for Metal Additive Manufacturing Powders,“ J. Mater., Bd. 67, p. 538, 2015.
- A. B. Spierings, M. Voegtlin, T. Bauer und K. Wegener, „Powder fowability characterisation methodology for powder-bed-based metal additive manufacturing,“ Prog. Addit. Manuf., Bd. 1, p. 9, 2016.
- T. M. Wischeropp, C. Emmelmann, M. Brandt und A. Pateras, „Measurement of actual powder layer height and packing density in a single layer in selective laser melting,“ Addit. Manuf., Bd. 28, p. 176, 2019.
- Y. Mahmoodkhani, U. Ali, S. Imani Shahabad, A. Rani Kasinathan, R. Esmaeilizadeh, A. Keshavarzkermani, E. Marzbanrad und E. Toyserkani, „On the measurement of effective powder layer thickness in laser powder-bed fusion additive manufacturing of metals,“ Prog. Addit. Manuf., Bd. 4, p. 109, 2019.
- M. Lutter-Günther, M. Bröker, T. Mayer, S. Lizak, C. Seidel und G. Reinhart, „Spatter formation during laser beam melting of AlSi10Mg and effects on powder quality,“ Procedia CIRP, Bd. 74, p. 33, 2018.
- T. Wohlers, „3D printing and additive manufacturing state of the industry: annual worldwide progress report,“ Wohlers Report, 2017.
- B. A. Hann, „Powder Reuse and Its Effects on Laser Based Powder Fusion Additive Manufactured Alloy 718,“ in SAE 2016 Aerospace Systems and Technology Conference, Warrendale, PA, 2016.
- Y. Liu, Y. Yang, S. Mai, D. Wang und C. Song, „Investigation into spatter behavior during selective laser melting of AlSi 316L stainless steel powder,“ Materials & Design, Bd. 87, p. 797, 2015.
- D. Wang, S. Wu, F. Fu, S. Mai, Y. Yang, Y. Liu und C. Song, „Mechanisms and characteristics of spatter generation in SLM processing and its effect on the properties,“ Material & Design, Bd. 117, p. 121, 2017.
- M. Taheri Andani, R. Dehghani, M. R. Karamooz-Ravari, R. Mirzaeifar und J. Ni, „A study on the effect of energy input on spatter particles creation during selective laser melting process,“ Addit. Manuf., Bd. 20, p. 33, 2018.
- ISO 13320:2020-01, Particle size analysis - Laser diffraction methods, 2020.
- ISO 13322-2:2006-11, Particle size analysis - Image analysis methods - Part 2: Dynamic image analysis methods, 2006.
- ISO 9276-6:2008-09, Representation of results of particle size analysis - Part 6: Descriptive and quantitative representation of particle shape and morphology, 2008.

This information has been sourced, reviewed and adapted from materials provided by Bettersize Instruments.
For more information on this source, please visit Bettersize Instruments.