An established tool for the authentication and conservation of fine art paintings, Fourier-transform infrared spectroscopy (FTIR) typically requires the removal of small sample sections for analysis. FTIR reflectance spectroscopy, by contrast, offers a non-destructive and non-contact method of analysis.
Results from several samples are presented in this study in the regions of both mid-infrared spectroscopy (mid-IR) and far-infrared spectroscopy (far-IR), which demonstrates the capability of reflectance mode measurements to offer a glimpse into the components of these paints.
Identifying paint components in as much detail as possible is essential for the authentication and conservation of fine-art paintings. Moreover, characterizing the correct materials is essential when it comes to establishing the period of a piece’s origin or determining the optimum restoration or conservation procedure.
Given that artists’ paints are combinations of fillers, binders, and pigments that have spanned many materials over time, this characterization is a demanding task. In the characterization of artists’ paints, FTIR has proven to be an effective tool.
FTIR, in the past, typically required a small portion of the artwork to be removed for investigation using infrared (IR) microscopy. Analysis by IR microscopy can be carried out using several sampling techniques. The most common of these being attenuated total reflectance (ATR) and transmission modes.
Spectral collection by transmission necessitates that the sample to be thin enough to produce a good quality spectrum, which could involve compressing or cutting the sample to a depth of about 5 to 30 microns.
Alternatively, ATR needs a good degree of contact between the sample and the ATR crystal. The reflectance mode is the third technique of microscopy, which offers the benefit of non-contact analysis. However, a section of the sample for analysis is required for positioning a sample under a microscope.
The Thermo Scientific™ ConservatIR™ FTIR External Reflection Accessory for reflectance analysis eliminates the need to put the sample onto a microscope stage or in a standard sample compartment and facilitates that all-important no-contact analysis.
This article illustrates the use of non-contact, non-destructive IR measurement using the ConservatIR FTIR External Reflection Accessory with a Thermo Scientific™ Nicolet™ iS50 FTIR Spectrometer to characterize various paints used in art.
Experimental
Various artist paints and an artist acrylic medium that are presently available on the market were each brushed on separate pieces of card stock and left to dry.
The ConservatIR External Reflection Accessory has its sampling aperture located at the end of an arm and has a wide range of possible angles, which facilitates the measurement of samples outside of the spectrometer’s sample compartment at different sample orientations.
By positioning the sample 1 to 2 mm from the sampling aperture of the ConservatIR External Reflection Accessory, reflectance spectra were collected using the ConservatIR External Reflection Accessory mounted in a Thermo Scientific iS50 FTIR Spectrometer.
By maximizing the IR signal and observing a sharp ConservatIR External Reflection Accessory video image in real-time, the final optimum sampling distance was determined (Figure 1).

Figure 1. ConservatIR External Reflection Accessory video image of Prussian Blue oil paint. Image Credit: Thermo Fisher Scientific – Materials & Structural Analysis
To serve as a comparison to reflectance measurements ATR spectra were also collected. ATR spectra were measured with the built-in ATR of the iS50 FTIR Spectrometer using its pressure tower to provide good contact between the diamond ATR crystal and the sample.
Using a KBr beamsplitter, all mid-IR spectra were collected from 4,000 to 400 cm-1 at 4 cm-1 resolution. For mid-IR reflectance measurements, a DTGS detector with a KBr window was used.
The dedicated DTGS detector of the built-in ATR of the iS50 was used to take the mid-IR ATR measurements. A solid substrate beamsplitter was used to collect far-IR spectra from 1800 to 100 cm-1 at 4 cm-1 resolution.
A deuterated triglycine sulfate (DTGS) detector with a polyethylene window was used to collect reflectance far-IR spectra. When it comes to collecting far-IR ATR spectra, the iS50 FTIR Spectrometer’s built-in ATR dedicated DTGS detector proved ideal and was used to collect spectra in the same range.
Where indicated, all spectra were measured with Thermo Scientific™ OMNIC™ Software and Kramers-Kronig (KK) transformation along with ATR corrections through OMNIC Software were applied.
Results and Discussion
Mid-IR Paint Analysis: Examples
The effectiveness of FTIR reflectance spectroscopy, when applied to paint measurements in the mid-IR spectral region, is demonstrated in Figure 2. The sample shown is Pyrrole Red, an acrylic paint and synthetic pigment developed in the 1980s.1
A derivative-like shape commonly seen in specular reflection measurements due to anomalous dispersion is seen in many portions of the reflectance spectrum in Figure 2A. Figure 2B shows the KK-transformed and baseline-corrected spectrum.
Figure 2C demonstrates the effectiveness of the KK transformation and shows an excellent agreement between the spectrum of the same sample measured by ATR and the corrected reflectance spectrum.

Figure 2. Pyrrole Red acrylic paint sample: (A) Reflectance spectrum (B) Reflectance spectrum after KK transformation and baseline correction, and (C) ATR spectrum. ATR spectrum of artist acrylic medium shown for comparison (D). Image Credit: Thermo Fisher Scientific – Materials & Structural Analysis
Finally, Figure 2D confirms the presence of an acrylic binder in this paint by the comparison with the spectrum of an artist’s acrylic medium, where the binder material’s key peaks are at approximately 1730, 1450, and 1180 cm-1 are clearly visible in the paint spectra.
Another example of characterizing paint components using FTIR non-contact reflectance measurement is shown in Figure 3. A sample of oil paint containing the pigment Prussian Blue was measured in this case. Prussian Blue is a synthetic pigment that has been commercially available since 1724 and was first synthesized in 1704.2
Spectrum A is the reflectance spectrum obtained from this sample using the ConservatIR External Reflection Accessory, as is shown in Figure 3. A strong peak is displayed by the KK transformed spectrum (Figure 3B) at approximately 2100 cm-1, which is attributed to the basis of Prussian Blue - C≡N stretch of the cyano groups in iron hexacyanoferrate.
In figure 3B, the KK-transformed spectra is almost identical to the sample’s ATR spectrum (Figure 3C), which further demonstrates the usefulness of the KK transformation in the quest to produce a more conventional IR spectrum.

Figure 3. Prussian Blue oil paint sample: (A) Reflectance spectrum (B) Reflectance spectrum after KK transformation and baseline correction, (C) ATR spectrum after ATR correction. (D) Library spectrum of alumina trihydrate. Image Credit: Thermo Fisher Scientific – Materials & Structural Analysis
By comparing the paint spectrum to a library spectrum of alumina trihydrate (Figure 3D), the presence of alumina trihydrate, a filler that enhances the color in paints, is also confirmed in the sample - most notably by the spectral similarities in the 3700–3200 cm-1 and 1000–500 cm-1 regions.
Benefits of Far-IR Range and Combined Mid-IR Range
All-reflectance optics are features in the ConservatIR External Reflection Accessory, which means that, once the FTIR Spectrometer has been properly configured, measurements in both the far-IR and mid-IR ranges can be taken. When paints contain inorganic pigments that typically have only weak or no mid-IR spectral signatures, the far-IR measurements can be particularly useful.
A comparison of two acrylic paint samples: Zinc White and Titanium White, is illustrated In Figure 4 – each of which appears to be almost identical in color to the other. Figures 4A and 4B show the fingerprint region of both the far-IR and the mid-IR portions of the KK transformed spectra of the two paints.
Figure 4C shows that the mid-IR region of the two spectra are almost indistinguishable from one another because both are dominated by spectral features of the acrylic binder.
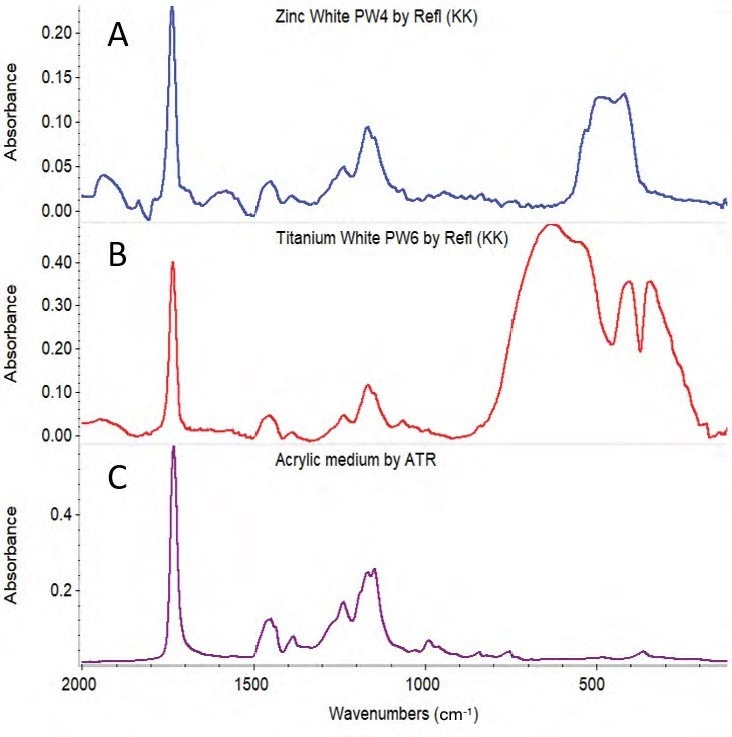
Figure 4. Reflectance spectrum of acrylic paint samples after KK transformation and baseline correction: (A) Zinc White and (B) Titanium White. ATR spectrum of acrylic medium (C) shown for comparison. Image Credit: Thermo Fisher Scientific – Materials & Structural Analysis
However, the two pigment types can be readily distinguished by the spectra in the far-IR region (800 to 100 cm-1).
To readily differentiate traditional inorganic pigments from more recently developed in synthetic organic pigments of similar color, FTIR multi-range reflectance analysis can be applied. Synthetic organic pigments often contain their strongest features in the mid-IR region, while inorganic pigments tend to yield spectral features only in the far-IR region.
A comparison between two acrylic paints, benzimidazolone yellow and cadmium yellow, is shown in Figure 5.

Figure 5. Reflectance spectrum of acrylic paint sample after KK transformation and baseline correction: (A) Benzimidazolone Yellow (B) Reflectance spectrum of Cadmium Yellow. ATR spectrum of acrylic medium (C) shown for comparison. Image Credit: Thermo Fisher Scientific – Materials & Structural Analysis
Cadmium yellow pigment has been commercially available since 1919 and is comprised of cadmium sulfide (CdS).3 Benzimidazolone yellow, on the other hand, was developed in the 1960s and is a synthetic organic pigment that was introduced as artist pigment in the late 1970s.1 Figure 5 shows the reflectance spectra obtained from these two paints after KK transformation.
Features of the acrylic binder of the paint (peaks at 1740, 1470, and 1170 cm-1) dominate the cadmium yellow paint in the mid-IR region. The benzimidazolone yellow organic pigment, by contrast, has both the same acrylic peaks observed in cadmium yellow and many strong features in the mid-IR.
Cadmium yellow has a strong, broad absorption at 275 cm-1, as shown by further examination of the far-IR spectrum. Therefore, insight into the composition of both paints is provided by both spectral regions.
To obtain the pigment spectrum of benzimidazolone, the spectrum of the artist acrylic medium sample was subtracted from the reflectance spectrum of benzimidazolone yellow paint (Figure 6A). The results are displayed in Figure 6B. As shown in Figure 6C, the resulting spectrum is an extremely accurate match to the commercial library spectrum of that pigment in powder form.

Figure 6. (A) Reflectance spectrum of benzimidazolone yellow acrylic paint sample after KK transformation and baseline correction (B) Result after spectral subtraction of the acrylic medium from corrected benzimidazolone yellow spectrum (C) Library spectrum of benzimidazolone yellow for comparison. Image Credit: Thermo Fisher Scientific – Materials & Structural Analysis
Conclusions
A straightforward non-contact method is provided by FTIR reflectance spectroscopy with the ConservatIR External Reflection Accessory by which to obtain component information in artists’ paint, particularly for those samples which would not easily fit on a conventional FTIR sampling compartment or a microscope stage.

Thermo Scientific Nicolet iS50 FTIR Spectrometer with the ConservatIR External Reflection Accessory. Image Credit: Thermo Fisher Scientific – Materials & Structural Analysis
The application of KK transformation to the raw reflectance spectra is an integral part of the measurements, which produce spectra more consistent with other FTIR methodologies, like ATR.
Lastly, facile measurements in spectral regions outside of the mid-IR range are facilitated by the use of all-reflective optics in the ConservatIR External Reflection Accessory – a feature that is particularly useful in the analysis of inorganic pigments containing spectral features solely in the far-IR region.
The ConservatIR External Reflection Accessory can be utilized with any Thermo Scientific FTIR Spectrometer, but in these cases, it was paired with a Nicolet iS50 FTIR Spectrometer.
References
- 1. “Synthetic Organic Pigments.” Bruce MacEvoy, https://www.handprint.com/HP/WCL/pigmt1d.html#DPP.
- 2. “Pigments through the ages: Prussian Blue.” WebExhibits, http://www.webexhibits.org/pigments/indiv/history/prussblue.html.
- 3. “Pigments through the ages: Cadmium yellow/red.” WebExhibits, http://www.webexhibits.org/pigments/indiv/history/cdyellowred.html

This information has been sourced, reviewed and adapted from materials provided by Thermo Fisher Scientific – Materials & Structural Analysis.
For more information on this source, please visit Thermo Fisher Scientific – Materials & Structural Analysis.