For the production of highly efficient solar cells, efficient charge carrier extraction is essential, and to enhance charge extraction, electron and hole extraction layers are routinely incorporated into the solar cell stack.
When it comes to optimizing cell performance, it is essential that the extraction efficiency of various extraction layers is researched and compared. As photoluminescence (PL) is proportional to the number of charge carriers in the perovskite, photoluminescence spectroscopy is the ideal method of choice when carrying out this comparison.
To allow for PL to take place, the photogenerated electrons and holes in the perovskite layer must recombine. The transfer of electrons or holes into adjacent layers will inhibit radiative electron-hole recombination within the perovskite layer and decrease the PL response (Figure 1).
The effectiveness with which electrons or holes are extracted from the perovskite layer can be studied by tracking the PL’s intensity.
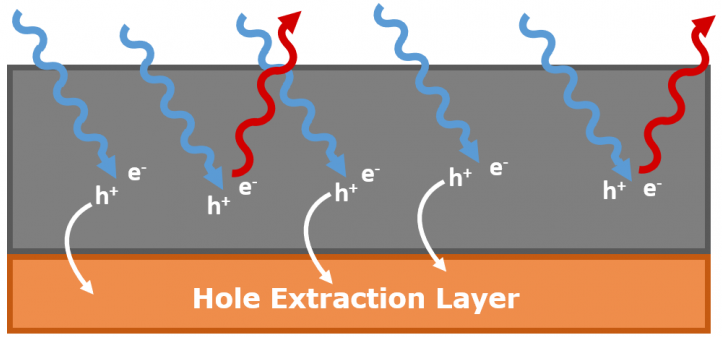
Figure 1. Interplay between excitation (blue arrows), photoluminescence (red arrows), and charge extraction (white arrows) in a perovskite layer. Image Credit: Edinburgh Instruments
Vertically aligned carbon nanotubes (VACNTs) are one promising substance being researched as a potential hole extraction layer in perovskite solar cells. PL spectroscopy with an Edinburgh Instruments FLS1000 Photoluminescence Spectrometer is used to examine the extraction effectiveness of a VACNT hole extraction layer.
Experimental Setup
On top of Glass/ITO and Glass/ITO/VACNT substrates, a layer of mixed halide Cs0.05FA0.79MA0.16PbI2.4Br0.6 perovskite was spin-coated. The accompanying publication contains comprehensive information on sample fabrication.1 The Edinburgh Instruments FLS1000 Photoluminescence Spectrometer was used to evaluate the PL of the two perovskite samples.
The FLS1000 was equipped with a 450 W Xenon Lamp, double excitation and double emission monochromators and a PMT-980 detector. The samples were held in the N-J03 Front Face Sample Holder for the comparison of relative PL intensities, and the N-M01 Integrating Sphere was used to calculate the PL quantum yields.
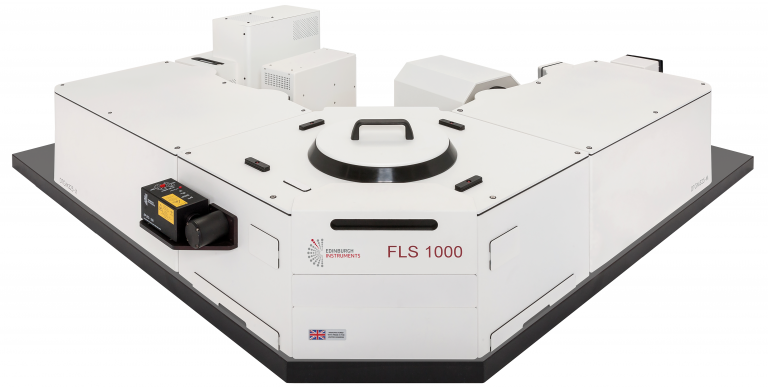
Figure 2. FLS1000 Photoluminescence Spectrometer. Image Credit: Edinburgh Instruments
Relative PL Intensity Comparison
The easiest method to analyze the impact of the VACNT layer on the hole extraction efficiency is by measuring the PL spectra of the Glass/ITO/Perovskite and Glass/ITO/VACNT/Perovskite and comparing their integrated PL intensities.
The PL intensity from the sample with the VACNT layer will be lower than the sample without the layer if the addition of the layer improves hole extraction (Figure 3).

Figure 3. Principle of the relative PL intensity comparison. Image Credit: Edinburgh Instruments
Figure 4 displays the PL spectra of the perovskite samples, which were held sequentially using the FLS1000’s N-J03 Front Face Sample Holder and measured under identical conditions (integration time, sample position and angle, excitation wavelength, and excitation and emission bandwidths) to compare the relative PL intensities. The perovskite sample with the VACNT layer has a significantly lower PL contribution.
Integrating the PL spectra using the Fluoracle® software of the FLS1000 reveals that the integrated PL intensity of the Glass/ITO/VACNT/Perovskite is 0.15x that of the Glass/ITO/Perovskite, indicating that hole extraction efficiency is significantly improved by the addition of the VACNT layer.
Perovskite solar cell design can be improved by using this method of comparing the relative PL intensity in general. This method of comparing the relative PL intensity can be applied generally when optimizing perovskite solar cells, and the effect of different electron and hole extraction layers, annealing temperatures, chemical compositions, post-processing treatments, etc., on the fraction of carriers that radiatively recombine can be studied and used to optimize solar cell designs.
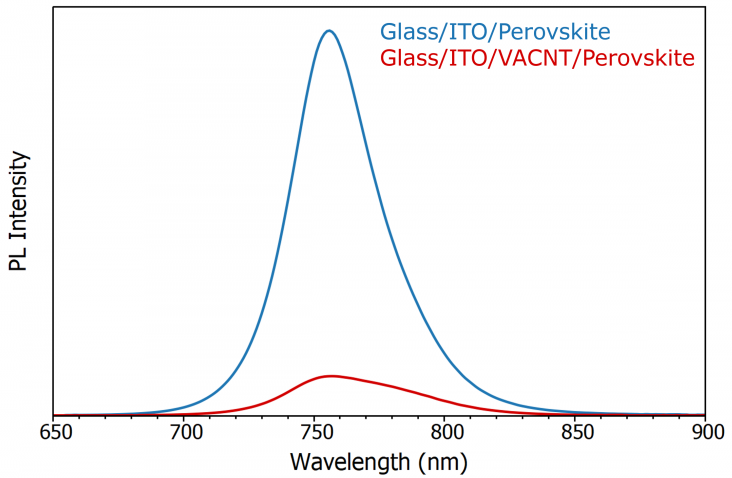
Figure 4. PL spectra of the perovskite samples with and without a VACNT layer. Image Credit: Edinburgh Instruments
However, this strategy needs to be used with caution. The intensity comparison assumes that all samples will exhibit the same fraction of photoluminescence collected by the spectrometer and the fraction of excitation light absorbed by the sample.
According to these presumptions, the comparison is valid because the ratio of spectra integrated intensities is equal to the ratio of photoluminescence quantum yields, provided the same experimental parameters are used to measure the spectra.
For solid samples, such as a perovskite spin-coated on a substrate, the precise position and angle of the sample in the spectrometer can have a significant impact on the amount of photoluminescence that is collected. The samples being compared must be set up in the spectrometer as similarly as possible to collect the same amount of photoluminescence.
The N-J03 solid sample holder, which has a linear position adjustment to let the user optimize the PL collected, serves as the FLS1000’s primary solid sample holder.
For relative intensity PL measurements, N-position J03’s should be optimized for the first sample before being used for all subsequent samples. For this reproducible positioning to be possible, the size and shape of the substrate must be the same for all samples.
The relative approach offers a quick and effective way to qualitatively investigate the effects of cell design and processing conditions on charge carrier extraction and recombination, provided that care is taken with positioning and the samples’ absorption properties are roughly equal.
PLQY with an Integrating Sphere
Calculating the photoluminescence quantum yield (PLQY) of each sample with an integrating sphere is a more reliable way to examine the hole extraction efficiency. A hollow, spectral-grade PTFE sphere called an integrating sphere collects all photoluminescence and scattered excitation light for detection (Figure 5).
The potential error associated with sample positioning is eliminated, and any variations in the absorption and reflection properties of the samples are taken into account by using an integrating sphere and computing the PLQY, leading to a more accurate comparison.
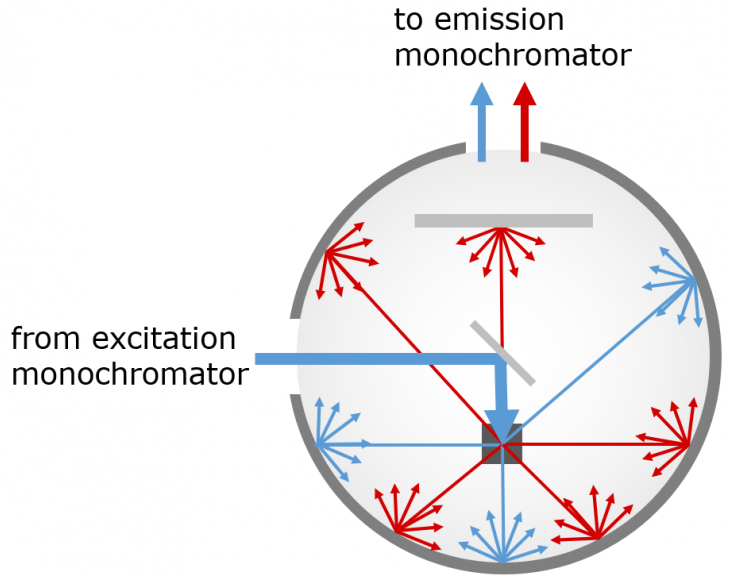
Figure 5. Operating principle of an integrating sphere for photoluminescence quantum yield. Excitation light is shown in blue and photoluminescence in red. Image Credit: Edinburgh Instruments
The FLS1000 was outfitted with the NM01 Integrating Sphere, which sits inside the sample chamber without the need for any fiber coupling or alignment, to measure the PLQY of the two perovskite samples.
As shown in Figure 6, the samples were sequentially placed on a PTFE scattering plug, excited at 430 nm, and the emission monochromator scanned over the scattering peak and photoluminescence peak.
Additionally, a reference measurement was made with just the PTFE scattering plug inside the sphere. The PLQY was then determined from the spectra using the Fluoracle Quantum Yield wizard.
When the desired integration ranges for scattering and emission are defined in the wizard, Fluoracle integrates over the reference and sample spectra and uses the equation below ro calculate the PLQY:
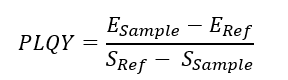
Source: Edinburgh Instruments
where SSample and SRef are the integrated intensities of the scattering peaks of the sample and reference, and ESample and ERef are the integrated intensities of the sample and reference emission.
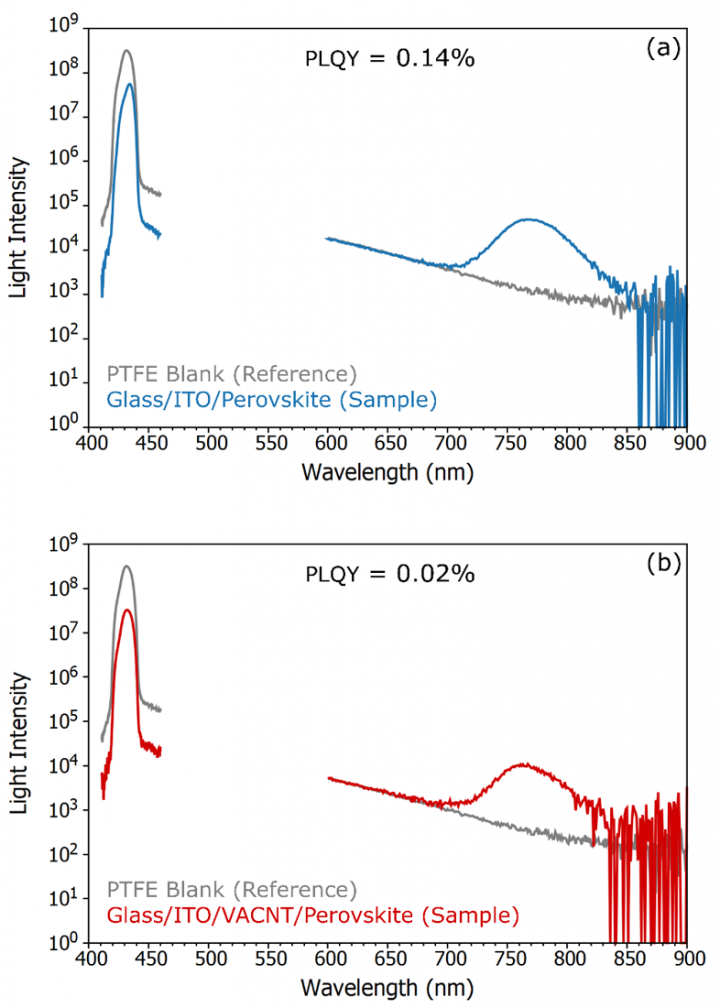
Figure 6. Spectra for the calculation of the photoluminescence quantum yield of the perovskite samples without (a) and with (b) a VACNT layer. Negative and zero values are displayed as 1 on the logarithmic plot. During measurement of the scattering peaks, an OD 2 neutral density filter was placed on the excitation side to attenuate the excitation intensity and the scattering peaks were re-scaled by the filter transmission ratio prior to calculation. The 600-900 nm PTFE blank spectra have been scaled by the ratio of the sample and reference scattering peaks to account for the lower sphere background when an absorbing sample is present. Image Credit: Edinburgh Instruments
In comparison to Glass/ITO/VACNT/Perovskite, the PLQY of the Glass/ITO/Perovskite was calculated to be 0.14%, confirming that the VACNT layer is curtailing radiative recombination in the perovskite layer due to improved hole extraction. The ratio of the PLQY values is 0.14, which is close to the PL intensity ratio of 0.15 obtained from the relative intensity method.
The close agreement can be attributed to the perovskite samples having identical substrates positioned as alike as possible and the VACNT layer not appreciably changing the reflection and absorption properties of the sample.
This result indicates that the relative approach only provides the ratio when these conditions are met, whereas the sphere approach always provides a more accurate comparison, greater flexibility, and, most importantly, the ability to calculate the PLQY of each sample.
From the PLQY values, the hole transfer efficiency into the VACNT layer can be calculated using the below equation:1,2
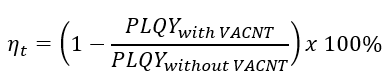
Source: Edinburgh Instruments
which gives a transfer efficiency of 86% using the PLQY values of 0.14% and 0.02%.
For an accurate calculation of the transfer efficiency, the PLQY of the sample without the transfer layer should be measured on an inert substrate such as SiO2 where no transfer can be assumed to occur.
The 86% represents the lower bound of the transfer efficiency because, in this case, PLQYwithout VACNT was measured on an ITO-coated substrate, into which some hole transfer will happen.
Conclusion
The FLS1000 Photoluminescence Spectrometer was used to examine the charge extraction capabilities of a VACNT hole extraction layer for perovskite solar cells. Both an absolute method using the FLS1000 integrating sphere and a relative intensity comparison method were used to examine the hole extraction performance.
This article highlights that the FLS1000 is an effective research tool for comparing the charge extraction properties of perovskite solar cells.
References
- V. Ferguson, B. Li, M. O. Tas, T. Webb, M. T. Sajjad, S. A. J. Thomson, Z. Wu, Y. Shen, G. Shao, J. V. Anguita, S. R. P. Silva, W. Zhang, Direct Growth of Vertically Aligned Carbon Nanotubes onto Transparent Conductive Oxide Glass for Enhanced Charge Extraction in Perovskite Solar Cells, Adv. Mater. Interfaces 7 2020, 2001121
- D. Aldakov, M. T. Sajjad, V. Ivanova, A. K. Bansal, J. Park, P. Reiss, I. D. W. Samuel, Mercaptophosphonic acids as efficient linkers in quantum dot sensitized solar cells, J. Mater. Chem. A 2015, 3, 19050
- Ferguson, V., et al. (2020) Direct Growth of Vertically Aligned Carbon Nanotubes onto Transparent Conductive Oxide Glass for Enhanced Charge Extraction in Perovskite Solar Cells. Advanced Materials Interfaces. doi:10.1002/admi.202001121

This information has been sourced, reviewed and adapted from materials provided by Edinburgh Instruments.
For more information on this source, please visit Edinburgh Instruments.