Microplastics have recently gained significant scientific and political attention and are now regarded as a critical environmental and health concern. This has led to a surge in research on microplastics, with a corresponding increase in funding to investigate their impact on human health and the environment at a global scale.
- O-PTIR is capable of providing precise IR measurement of microplastics ranging from sub-micron to 100 µm.
- The spectra generated by O-PTIR are free of artifacts and can be readily searched against pre-existing FTIR databases.
- O-PTIR offers a solution to several limitations of Raman spectroscopy while also producing complementary and confirmatory outcomes.
- Simultaneous collection of O-PTIR and Raman spectra of microplastic particles using the mIRage tool enables higher sample throughput and enhanced identification accuracy compared to standalone IR and Raman measurements.
- Combining fluorescence microscopy with O-PTIR enables efficient and precise identification and location of polymeric particles, leading to increased sample throughput.

Microplastics in the ocean. Image Credit: Photothermal Spectroscopy Corp
The concern about microplastics in water sources has prompted the introduction of new regulations and legislation by both federal and state governmental bodies in the United States. California Senate Bill 1422 (2018) is an example of such measures, which necessitate the assessment of microplastics in drinking water sources.
The recently introduced European Drinking Water Directive has mandated new regulations for monitoring microplastics. As a result, there is an anticipation that corresponding requirements will be adopted internationally in the coming years, leading to an upsurge in demand for microplastic testing.
The microplastics that pose the greatest potential risk of causing biological harm are those that are smaller than 20 µm.
Conducting chemical and morphological analysis of MP particles serves three main purposes. Firstly, it enables a better understanding of the sources of microplastics, which aids in taking steps to limit their release.
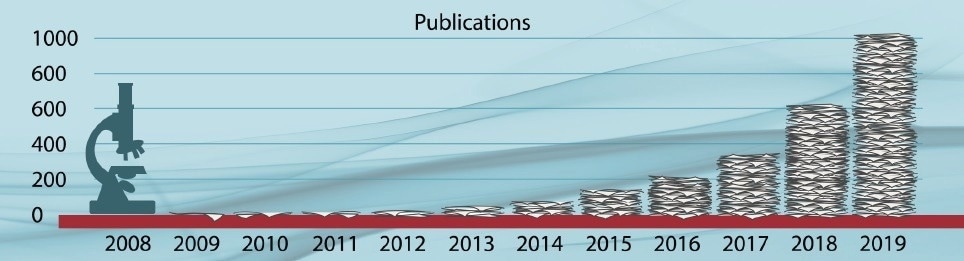
Microplastics scientific publications/year1. Image Credit: Photothermal Spectroscopy Corp
Secondly, it helps assess the potential environmental and human health hazards microplastics pose. Finally, it assists in identifying possible approaches for removing microplastic particles from the environment.
According to recent studies,1-4 the size range of microplastics that poses the highest potential risk of causing biological harm is the smaller size fraction (<20 µm). Therefore, achieving this size threshold is of significant importance.
Various techniques are employed to characterize the numerous aspects of microplastics. Among the most commonly utilized techniques for the chemical analysis of microplastics are traditional Fourier Transform Infrared (FT-IR) and Raman spectroscopy.
However, these techniques have certain limitations that hinder their widespread use for microplastic particles smaller than 20 μm, such as spatial resolution, measurement accuracy, throughput, photodamage, fluorescence interference, or other issues.
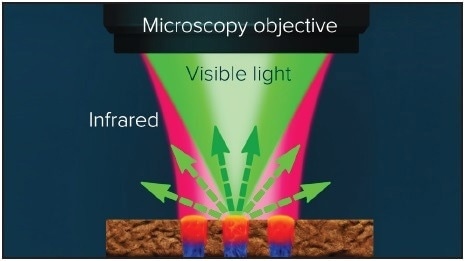
Figure 1. A pulsed tunable, IR source is focused on sample. Absorbed IR light causes the sample to heat up, creating a photothermal response. The visible probe laser centered in the diameter of the IR illuminated area detects the photothermal response from the sample upon IR absorption. Image Credit: Photothermal Spectroscopy Corp
Optical Photothermal Infrared (O-PTIR) spectroscopy is a fast-growing super-resolution technique that enables chemical analysis through infrared spectroscopy with a spatial resolution of about 500 nm.
O-PTIR provides a spatial resolution that is 10-30X better than conventional FT-IR microspectroscopy and avoids any spectral artifacts resulting from particle morphology, such as shape and size.
Moreover, O-PTIR eliminates the problems associated with low sensitivity, fluorescence interference, or photodamage, which can affect Raman.
Optical Photothermal IR (O-PTIR) Spectroscopy
The diffraction limit commonly associated with traditional IR microscopy techniques can be surpassed using the O-PTIR method.
This technique illuminates the sample with a mid-IR pulsed tunable laser and detects infrared absorption with a visible laser probe beam at 532 nm. This innovative method enables imaging with a resolution beyond what is possible with traditional IR techniques.
If the mid-IR laser is adjusted to a specific wavelength, it excites molecular vibrations in the sample and causes absorption, resulting in photothermal effects, such as sample surface expansion and alterations in the refractive index.
The photothermal response caused by molecular vibrations in the sample is detected by a visible probe laser focused to a spot size of ~0.5 µm. This response induces modulation in the scattered visible light, as shown in Figure 1.
The IR spectrum can be acquired by sweeping the mid-IR laser through the wavenumber range in under two seconds.
Comparison of O-PTIR and FT-IR Spectra for Plastics
Boke et al.5 conducted a comprehensive analysis of various plastics to assess the correlation between O-PTIR and standard FT-IR techniques.
This investigation demonstrated that the O-PTIR spectra were in excellent accordance with the FT-IR spectra, as depicted in Figure 2. The complete analysis can be found in the publication.
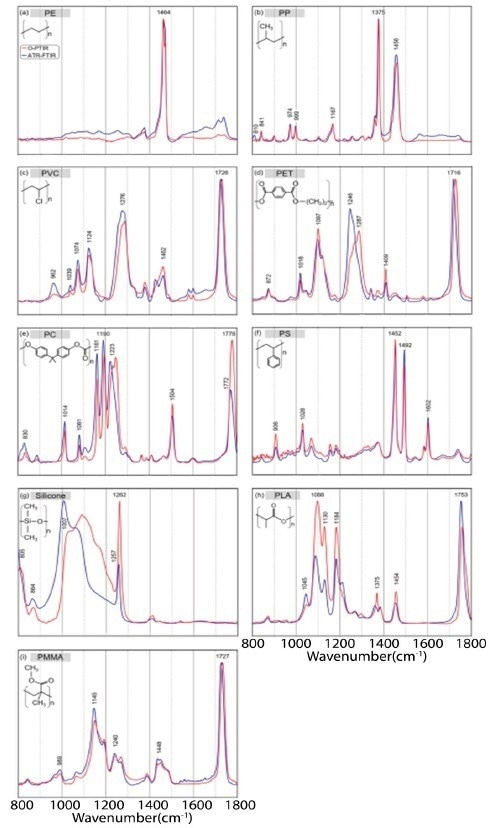
Figure 2. Normalized IR spectra from 1800 to 800 cm−1 of different plastics: polyethylene (PE) (a), polypropylene (PP) (b), polyvinyl chloride (PVC) (c), polyethylene terephthalate (PET) (d), polycarbonate (PC) (e), polystyrene (PS) (f), silicone (g), polylactide acid (PLA) (h), and polymethylmethacrylate (PMMA) (i), collected with standalone FT-IR system (blue) and the O-PTIR instrument collected in refection mode (red). Image Credit: Photothermal Spectroscopy Corp
O-PTIR Spectroscopy of Submicron Plastics
To showcase the ability of the mIRage system to analyze submicron IR plastics, a variety of plastic beads were examined using O-PTIR. The optical image and corresponding IR spectra of Polystyrene (PS) plastic beads with diameters ranging from 500 nm to greater than 4 µm are illustrated in Figure 3.
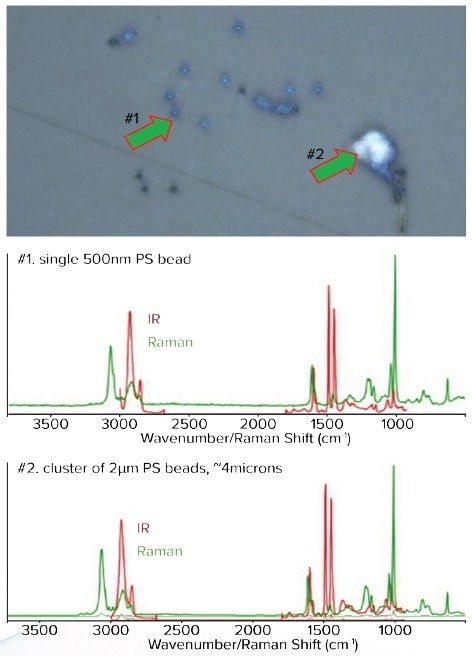
Figure 3. Top, Optical image of various sizes of small PS beads. Middle, The corresponding O-PTIR spectra from a 500 nm PS bead Bottom, Spectra from a 2 μm cluster of beads of approximately 4 μm in size. The IR spectra from single 500 nm bead or a cluster of 2 μm beads all look the same. The spectra are raw and unfiltered. Image Credit: Photothermal Spectroscopy Corp
Sub-Micron IR Shape and Size Independent Spectra
A mixed model sample comprising Polystyrene (PS) beads (900 nm, 2 μm, 4.5 μm, and 10 μm) and Poly(methyl methacrylate) (PMMA) was created to demonstrate the O-PTIR's capability of measuring various particle shapes and sizes while collecting artifact-free data, even in the presence of highly scattering salt crystals.
When using an FT-IR/QCL system, not only would the size of the particles be too small to measure, but the range of different particle sizes and the nearby presence of salt crystals would generate dispersive scatter artifacts, which can significantly alter the spectra, making accurate identification more difficult.
Mixed polymer bead samples were suspended in salt water and deposited onto a CaF2 substrate, interspersing polymer beads with salt crystals in Figure 4 to demonstrate the relative immunity of O-PTIR to scattering artifacts.
Figure 4 shows spectra collected from differently sized polymer beads, and, notably, there are no dispersive scatter artifacts present. This consistency in spectra confirms the correct identification of the polymer type, regardless of particle shape and size.
O-PTIR Single Frequency Imaging
Utilizing single-frequency imaging can greatly expedite the particle identification process, particularly when distinct key absorbing spectral features are known. In Figure 4, the primary bands from PS (1492 cm-1) and PMMA (1730 cm-1) were utilized in this manner.
One key attribute that sets O-PTIR apart is that it only generates a spectral response from sample absorbance, with other scattering particles having no impact on the resulting image.
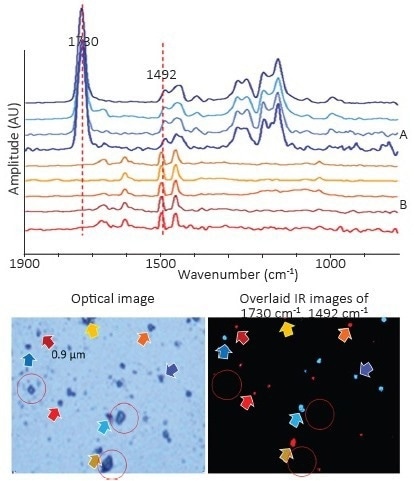
Figure 4. Top, spectra of PS and PMMA beads ranging in size from 0.9 μm to 10 μm. Bottom left, corresponding optical image. Bottom right, overlaid chemical image collected at 1492 cm-1 and 1730 cm-1 highlights both materials. Colors of the arrows correspond to the colors of the spectra. Salt crystals are highlighted in red circles. Note how no O-PTIR signal is observed in the IR image from the salt crystals. Image Credit: Photothermal Spectroscopy Corp
Figure 4 provides clear evidence of this attribute, where the location of salt crystals is circled.
They are clearly visible in the optical image and could easily be confused for polymer beads. However, in the single frequency image, only the polymer beads are highlighted, with salt crystals returning no response.
In contrast, traditional FT-IR and direct QCL microscope methods would severely distort the chemical images and show scattering artifacts in the spectra of particles located near salt crystals, which starkly contrasts the O-PTIR technique.
Artifact-Free IR Spectroscopy of Large Size and Colored Microplastics
Figure 5 displays O-PTIR measurements of various larger microplastic sizes and colors, demonstrating O-PTIR's ability to measure particles ranging from sub-micron to less than 1 mm in size.
The spectra obtained from these particles are free from any scattering artifacts, and there is no band saturation effect, which is commonly observed in traditional FTIR techniques, despite the particle sizes being almost 1 mm.
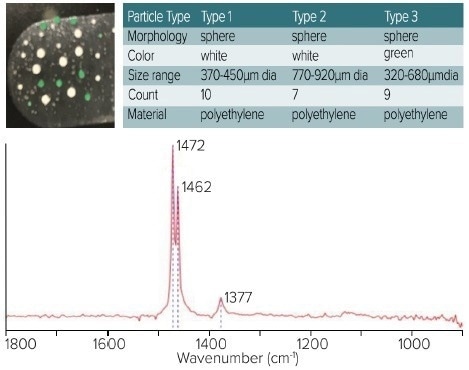
Figure 5. Top left, optical image shows location and color of the microplastics. Top right, table shows the types of microplastics. Bottom, spectra demonstrate artefact free measurements of the larger microplastic samples. Image Credit: Photothermal Spectroscopy Corp
Microplastics Characterization With Simultaneous IR and Raman and Dual IR/Raman Database Searching
Apart from the O-PTIR measurements, the visible probe laser produces Raman scattered light in the measurement region. This scattered light can be gathered to obtain both IR and Raman spectra simultaneously. The spatial resolution achieved is submicron, and the spectra can be collected at the same location and time.
Figure 6 illustrates a schematic diagram of the optical beam path. The combination of O-PTIR and Raman spectroscopy on a single system allows for co-located and simultaneous measurements, providing a powerful combination for a wider range of microplastic analysis.
Simultaneous acquisition of O-PTIR and Raman spectra provides complementary and confirmatory spectral information, resulting in more accurate identification and higher measurement productivity.
The effectiveness of this combined and correlative approach is demonstrated in a recent study,8 where a two-dimensional spectroscopy technique was employed. In this approach, both the IR and Raman Spectral Hit Quality (HQI) are displayed in a 2D scatter plot, as depicted in Figure 7 (top right) and (bottom right).
Sub 20 µm particles, identified as particle 1 and particle 2, were observed on the surface of the size fraction filters ranging from 0.8 µm to 20 µm.
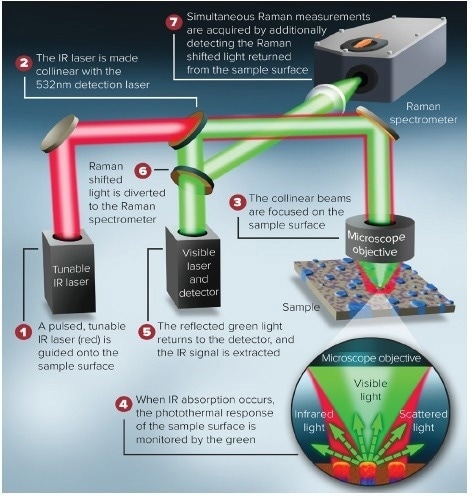
Figure 6. Schematic representation of the beam paths for the generation of simultaneous IR and Raman. Image Credit: Photothermal Spectroscopy Corp
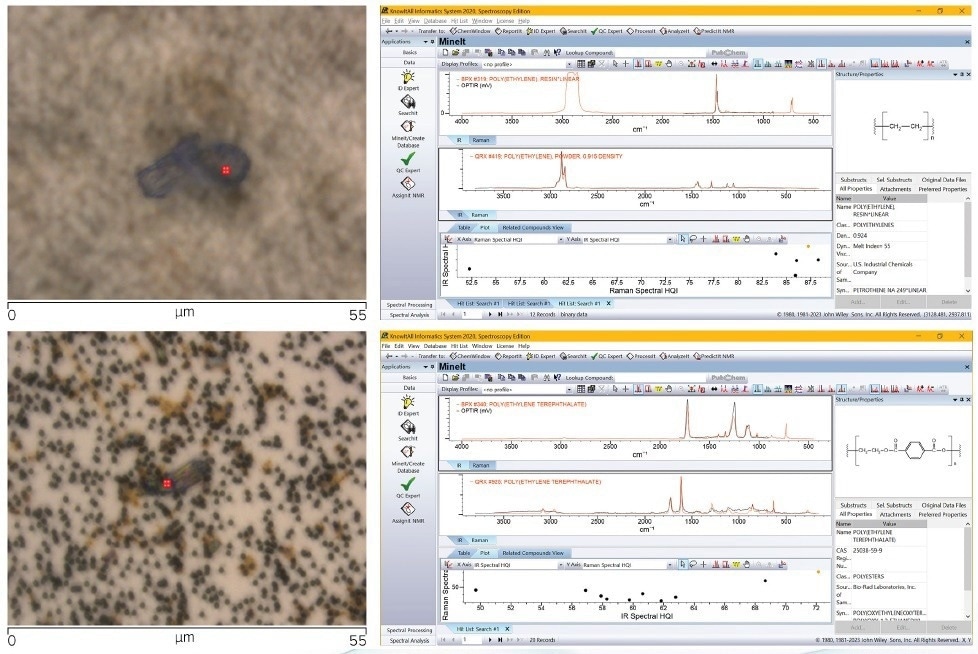
Figure 7. Top left, Optical image of particle 1 (40 x Cassegrain objective). Bottom left, Optical image of particle 2 (40 x Cassegrain objective). Top right, Wiley KnowItAll dual IR/Raman database search result for O-PTIR/Raman spectra collected on particle 1. Bottom right,Wiley KnowItAll dual IR/Raman database search result for O-PTIR/Raman spectra collected on particle 2. Image Credit: Photothermal Spectroscopy Corp
The corresponding simultaneously captured O-PTIR and Raman spectra are then searched using the dual IR/Raman searching capabilities of the Wiley KnowItAll® software.
The scatter plot resulting from the search displays the most probable matches in the upper right corner, with the highest combined Hit Quality Index (HQI) for both IR and Raman.
By utilizing the Raman HQI, the database search can effectively sift through an extensive array of potential identifications.
In this particular instance, the Raman HQI serves as a useful tool in excluding a significant number of comparable materials, which ultimately increases the level of confidence in the search results.
Microplastics Localization with Fluorescence Microscopy
The combination of Nile Red staining and fluorescence has been previously employed to locate and quantify polymeric particles within a sample. However, this method is limited in its ability to differentiate between various types of polymers.6
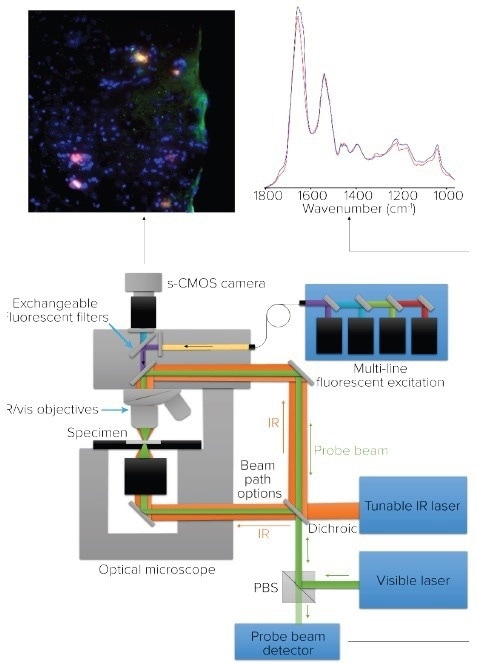
Figure 8. Microscope schematic for O-PTIR and co-located fluorescence microscopy. Image Credit: Photothermal Spectroscopy Corp
Nile Red stain interacts with hydrocarbon (CH) chains in polymeric materials, as it is lipophilic. This interaction enables fluorescence imaging to identify the location of microplastics.7
The ability of the Nile Red stain to exclusively locate polymer particles while ignoring extraneous particles, such as sand or biological matter, enhances system throughput.
As a result, the system can avoid the time-wasting process of analyzing non-polymeric samples and alleviate the need for meticulous sample preparation and clean-up procedures.
Nevertheless, the use of Nile Red staining solely for imaging purposes does not furnish any chemical characterization of the observed particles. Therefore, additional chemical analysis is necessary to conclusively determine the particle's material composition.
The mIRage-LS system facilitates productive chemical identification of microplastics by providing co-located O-PTIR and fluorescence microscopy capabilities.
mIRage-LS Principal of Operation: Co-Located O-PTIR and Fluorescence Microscopy
Figure 8 showcases the system design for a combined O-PTIR submicrometer IR microscope, which is co-located with fluorescence microscopy. The mIRage-LS system can operate in both reflection mode and the new high-resolution counter-propagating mode.
The pulsed IR beam in counter-propagating mode passes through the sample's underside while the fluorescence and visible probe beam paths are co-located using the microscope objective.
The mIRage-LS system's co-located O-PTIR and fluorescence feature enables the collection of a fluorescence image, followed by the collection of O-PTIR spectra for particles identified using Nile Red-stained imaging.
As the same objective is used for fluorescence imaging as well as O-PTIR data collection, there are no sample or image registration issues.
Figure 9 displays the fluorescent image of multiple particles (circled in red) acquired using a filter cube with excitation at 497 nm and emission at 535 nm. However, particles that do not exhibit fluorescence are also visible on the filter surface (circled in green).
By isolating microplastics from non-microplastic materials, Nile Red staining obviates the need for measuring and possibly misidentifying non-microplastics. This eradication of unnecessary measurements reduces analysis time and enhances accuracy.
Despite the possibility of collecting Raman spectra simultaneously, their usefulness is hampered by the large fluorescence background signal caused by Nile Red staining. However, the O-PTIR measurements remain unaffected by fluorescence, which is a fortunate advantage.
In addition, the presence of Nile Red dye does not alter the O-PTIR spectra, as its concentration is generally too low. The right-hand side of Figure 9 illustrates the results of the Wiley KnowItAll database search for the O-PTIR spectra obtained from the particles highlighted in the fluorescence image (a top, middle, and bottom).
The outcomes of the exploration indicate the identification of three distinct microplastics: PS, PE, and PMMA.
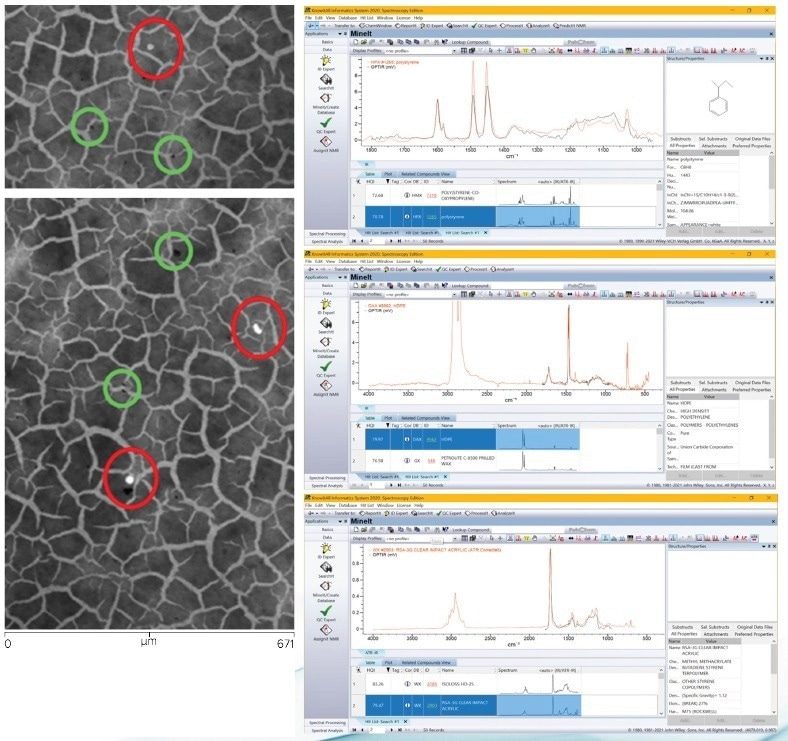
Figure 9. Left, Two areas of fluorescence image (Nile red stained) acquired using a GFP filter cube with excitation at 497 nm and emission at 535 nm. Right, Wiley KnowItAll database search results identifying each of the particles identified by imaging. Image Credit: Photothermal Spectroscopy Corp
Summary
Across a wide range of microplastic types, O-PTIR spectra have demonstrated an excellent correlation with FT-IR reference spectra.
Both the mIRage and mIRage-LS microscopes have successfully identified and analyzed microplastics of varying sizes, ranging from submicron particles to those larger than 500 µm.
The mIRage and mIRage-LS microscopes have successfully identified a range of microplastics, including 500 nm PS beads, sub-10 µm microplastics in water samples, and mixed model samples with different polymer types and sizes among salt crystals, without any spectral artifacts from size-dependent dispersive scattering (Mie scattering).
O-PTIR has measured microplastics larger than 500 µm with no band saturation.
Concurrent O-PTIR and Raman analyses have exhibited enhanced efficiency, precision, and a corroborative methodology for distinguishing various types of microplastics.
The O-PTIR spectra have been exported to the KnowItAll® database for digital exploration, which allows researchers to comprehend the complete composition of the tiniest microplastics.
To differentiate microplastics from non-plastic substances and to enhance the efficacy of microplastic measurements, O-PTIR and co-located fluorescence imaging using Nile Red stain was employed.
In general, O-PTIR delivers dependable and precise submicron IR spectroscopy for a diverse range of microplastics, from 100 µm's down to sub-micron sizes, and facilitates effortless integration with other multi-modal techniques.
The aforementioned capability renders O-PTIR a potent and adaptable technique for researchers to obtain precise measurements productively.
References
- Qin, F., et al., Bibliometric profile of global microplastics research from 2004 to 2019. International Journal of Environmental Research and Public Health, 2020. 17(16): p. 5639.
- Hale, R.C., et al., A Global Perspective on Microplastics. Journal of Geophysical Research: Oceans, 2020. 125(1): p. e2018JC014719.
- Wong, C.S.C., Scott, Standard Operating Procedures for Extraction and Measurement by Infrared Spectroscopy of Microplastic Particles in Drinking Water. 2021, Southern California Coastal Water Research Project Authority and California State Water Resources Control Board.
- Wong, C.S. and S. Coffin, Standard Operating Procedures for Extraction and Measurement by Raman Spectroscopy of Microplastic Particles in Drinking Water. 2021, Southern California Coastal Water Research Project Authority and California State Water Resources Control Board.
- Böke, J.S., Popp, J. and Krafft, C. Optical photothermal infrared spectroscopy with simultaneously acquired Raman spectroscopy for two-dimensional microplastic identification. Sci Rep 12, 18785 (2022). https://doi.org/10.1038/s41598-022-23318-2
- Myers, N., Catarino, A. I., Declercq, A. M., Brenan, A., Devriese, L., Vandegehuchte, M., De Witte, B., Janssen, C., Everaert, G., 2022. Microplastic detection and identification by Nile red staining: Towards a semiautomated, cost- and time-effective technique. Sci. Total Environ. Volume 823, 153441. https://doi.org/10.1016/j. scitotenv.2022.153441
- Maes, T., Jessop, R., Wellner, N., Haupt, K., Mayes, A. G., 2017. A rapid-screening approach to detect and quantify microplastics based on fluorescent tagging with Nile Red. Sci Rep 7, 44501. https://doi.org/10.1038/srep44501
Acknowledgments
PSC acknowledges Dr. Rae McNish for supplying the Nile Red-stained samples. Further reading O-PTIR for Microplastics

This information has been sourced, reviewed and adapted from materials provided by Photothermal Spectroscopy Corp.
For more information on this source, please visit Photothermal Spectroscopy Corp.