Sponsored by Metrohm AGReviewed by Olivia FrostMay 16 2023
Fruit juices are popular due to their refreshing nature, nutritional benefits, and ability to provide instant energy. As fruit juices are typically sweet beverages, accurately determining sugar components is crucial in the industry.
Image Credit: ShutterStock/Bigc Studio
Fructose, glucose, and sucrose require careful monitoring. Conventional laboratory methods for sugar determination in fruit juices involve liquid chromatography and polarimetric and refractive index measurements. However, this approach is time-consuming and requires specialized equipment.
Near-infrared spectroscopy (NIRS) is an alternative analytical technique that rapidly calculates glucose, fructose, and sucrose in fruit juices in less than one minute. This method is advantageous because it does not require chemicals and eliminates the need for sample preparation.
Experimental Equipment
To develop a prediction model for quantification, 27 samples were prepared, including aqueous solutions of glucose (0–8 g/100 mL), fructose (0–8 g/100 mL), and sucrose (0–8 g/100 mL). All samples were measured using a Metrohm NIRS DS2500 Liquid Analyzer in transmission mode (400–2500 nm, Figure 1) with a holder for 2 mm vials.
Using disposable vials with a 2 mm path length eliminated the need for cleaning the sample vessels, adding to the convenience of the setup. Ten different fruit juices were measured using the same setup, and the content of glucose, fructose, and sucrose was predicted using the aforementioned prediction models.
The reference method used for measuring the concentration of different sugars in the juice samples was Ion Chromatography (IC). All data acquisition and prediction model development were performed using the Metrohm software package Vision Air Complete.
Table 1. Hardware and software equipment overview. Source: B&W Tek
| Equipment |
Article number |
| DS2500 Liquid Analyzer |
2.929.0010 |
| DS2500 Holder 2 mm vials |
6.749.2000 |
| Disposable vials, 2 mm |
6.7402.070 |
| Vision Air 2.0 Complete |
6.6072.208 |
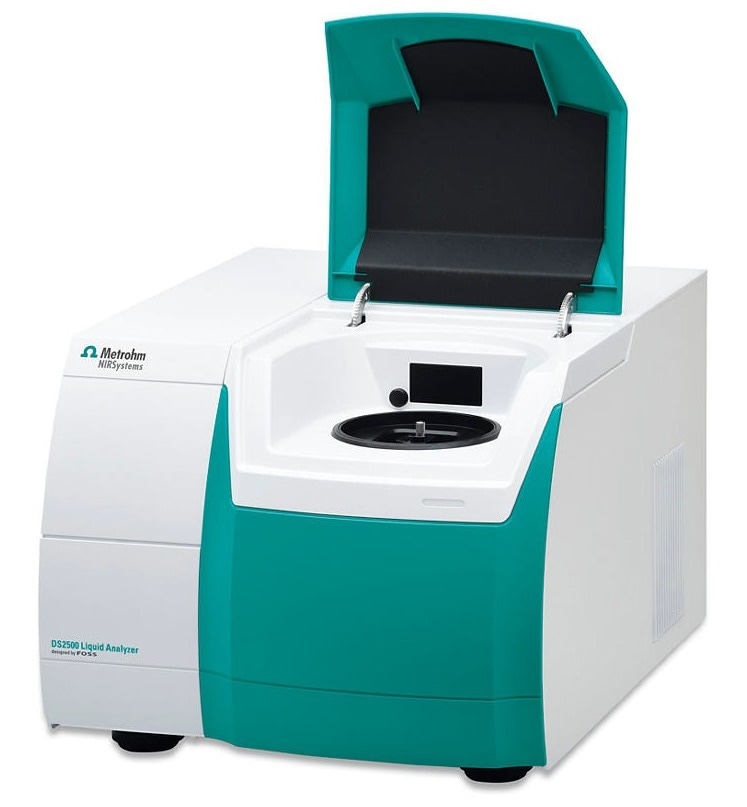
Figure 1. Metrohm NIRS DS2500 Liquid Analyzer used for the determination of various sugars in fruit juices. Image Credit: B&W Tek
Result
Figure 2 displays the Vis-NIR spectra obtained and utilized to develop a prediction model for quantifying glucose, fructose, sucrose, and total sugars. The prediction model’s performance was evaluated using correlation diagrams, demonstrating a strong correlation between the Vis-NIR prediction and the reference values.
Figures 3–6 depict the corresponding figures of merit (FOM), which demonstrate the expected precision of a prediction during routine analysis. Figure 7 presents the Standard Error of Prediction (SEP) for each component measured in this study.
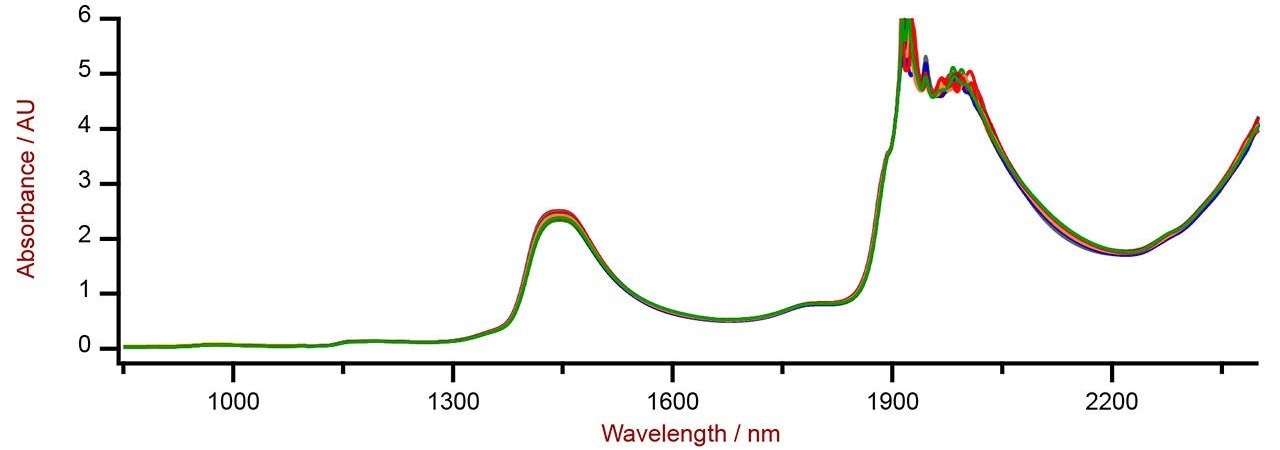
Figure 2. Selection of Vis-NIR spectra of an aqueous mixture of glucose, fructose, and sucrose analyzed on a DS2500 Liquid Analyzer. Image Credit: B&W Tek
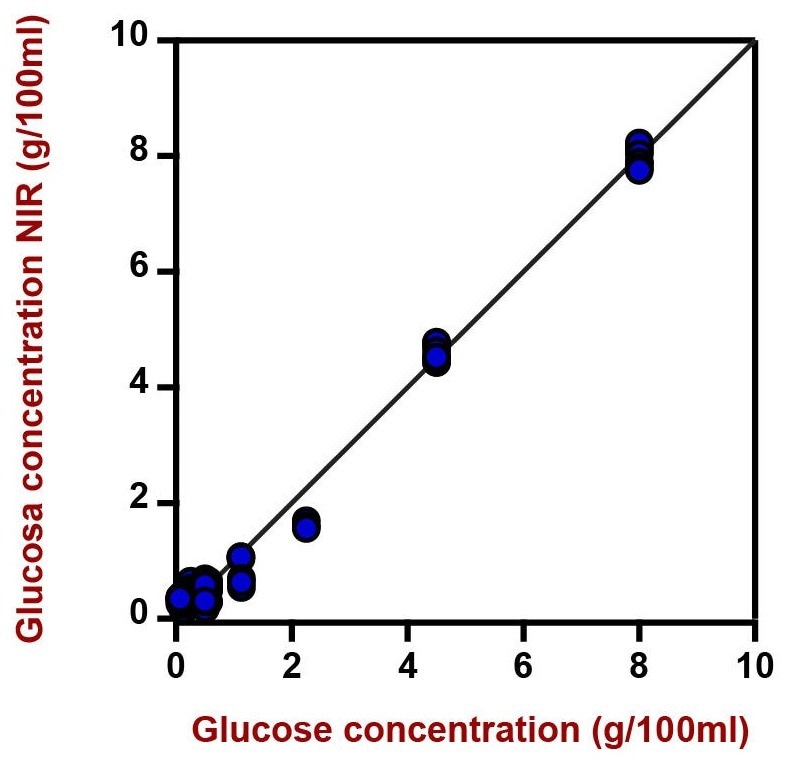
| Figures of Merit |
Value |
| R2 |
0.9913 |
| Standard Error of Calibration |
0.2586 (g/100 mL) |
| Standard Error of Cross-Validation |
0.2633 (g/100 mL) |
Figure 3. Correlation diagram and the respective figures of merit for the prediction of glucose in an aqueous mixture of sugars using a DS2500 Liquid Analyzer. The lab value was evaluated with IC. Image Credit: B&W Tek
| Figures of Merit |
Value |
| R2 |
0.9967 |
| Standard Error of Calibration |
0.1682 (g/100 mL) |
| Standard Error of Cross-Validation |
0.1876 (g/100 mL) |
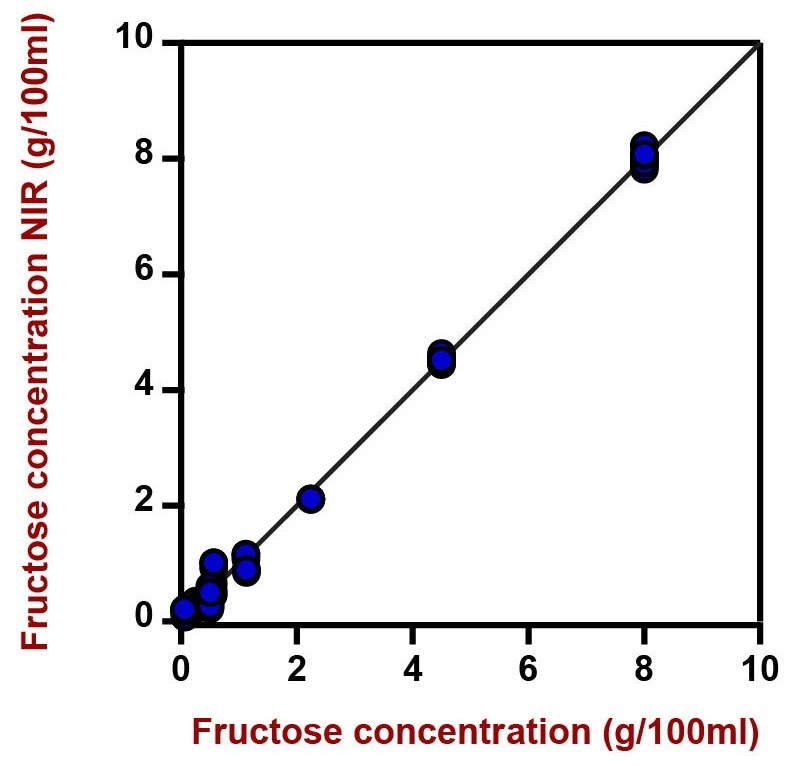
Figure 4. Correlation diagram and the respective figures of merit for the prediction of fructose content in an aqueous mixture of sugars using a DS2500 Liquid Analyzer. The lab value was evaluated with IC. Image Credit: B&W Tek
| Figures of Merit |
Value |
| R2 |
0.9902 |
| Standard Error of Calibration |
0.2390 (g/100 mL) |
| Standard Error of Cross-Validation |
0.2401 (g/100 mL) |
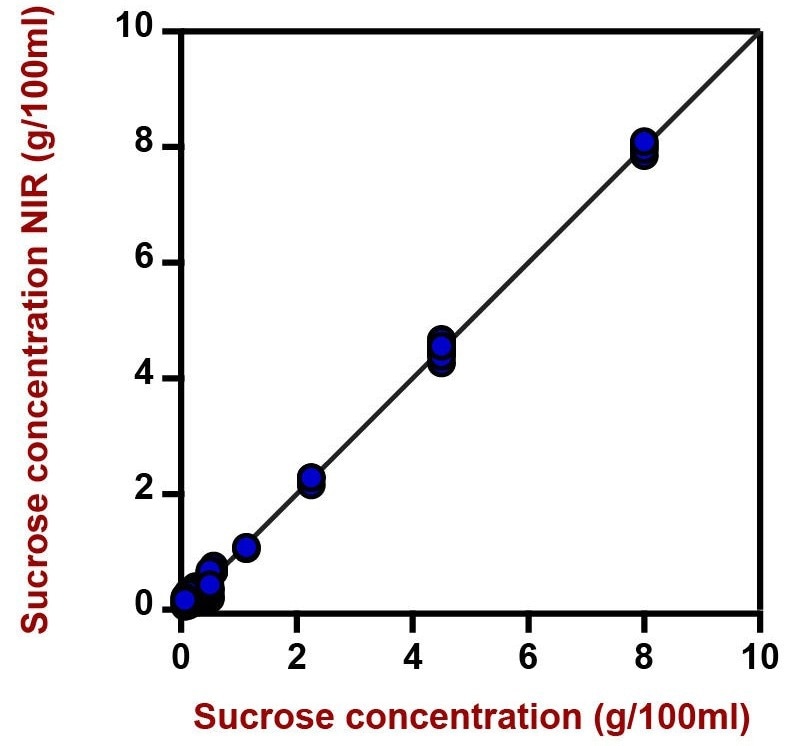
Figure 5. Correlation diagram and the respective figures of merit for the prediction of sucrose content in an aqueous mixture of sugars using a DS2500 Liquid Analyzer. The lab value was evaluated with IC. Image Credit: B&W Tek
| Figures of Merit |
Value |
| R2 |
0.9985 |
| Standard Error of Calibration |
0.2718 (g/100 mL) |
| Standard Error of Cross-Validation |
0.2770 (g/100 mL) |
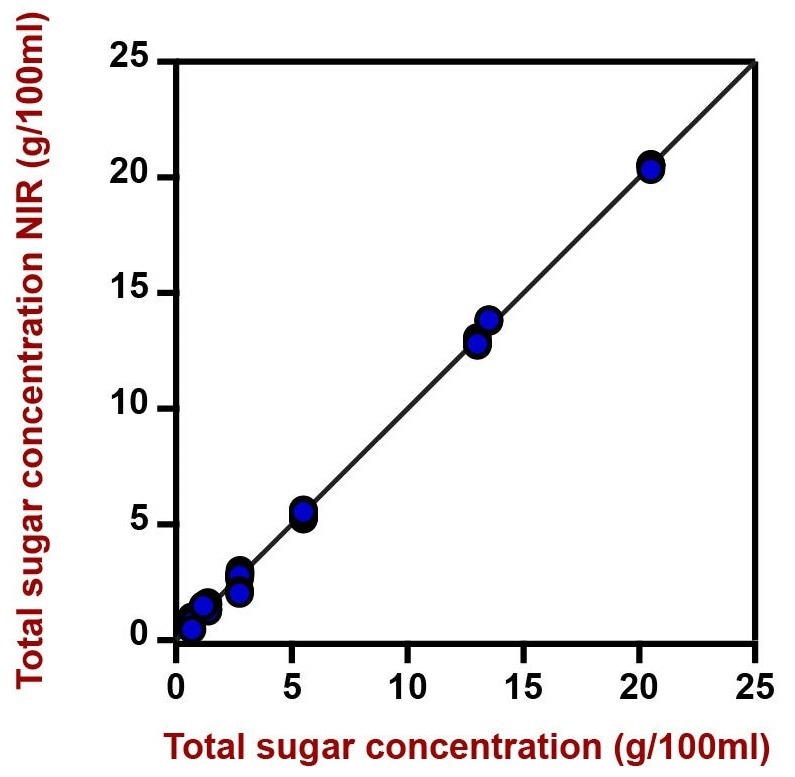
Figure 6. Correlation diagram and the respective figures of merit for the prediction of total sugars in an aqueous mixture of sugars using a DS2500 Liquid Analyzer. The lab value was evaluated with a refractometer. Image Credit: B&W Tek
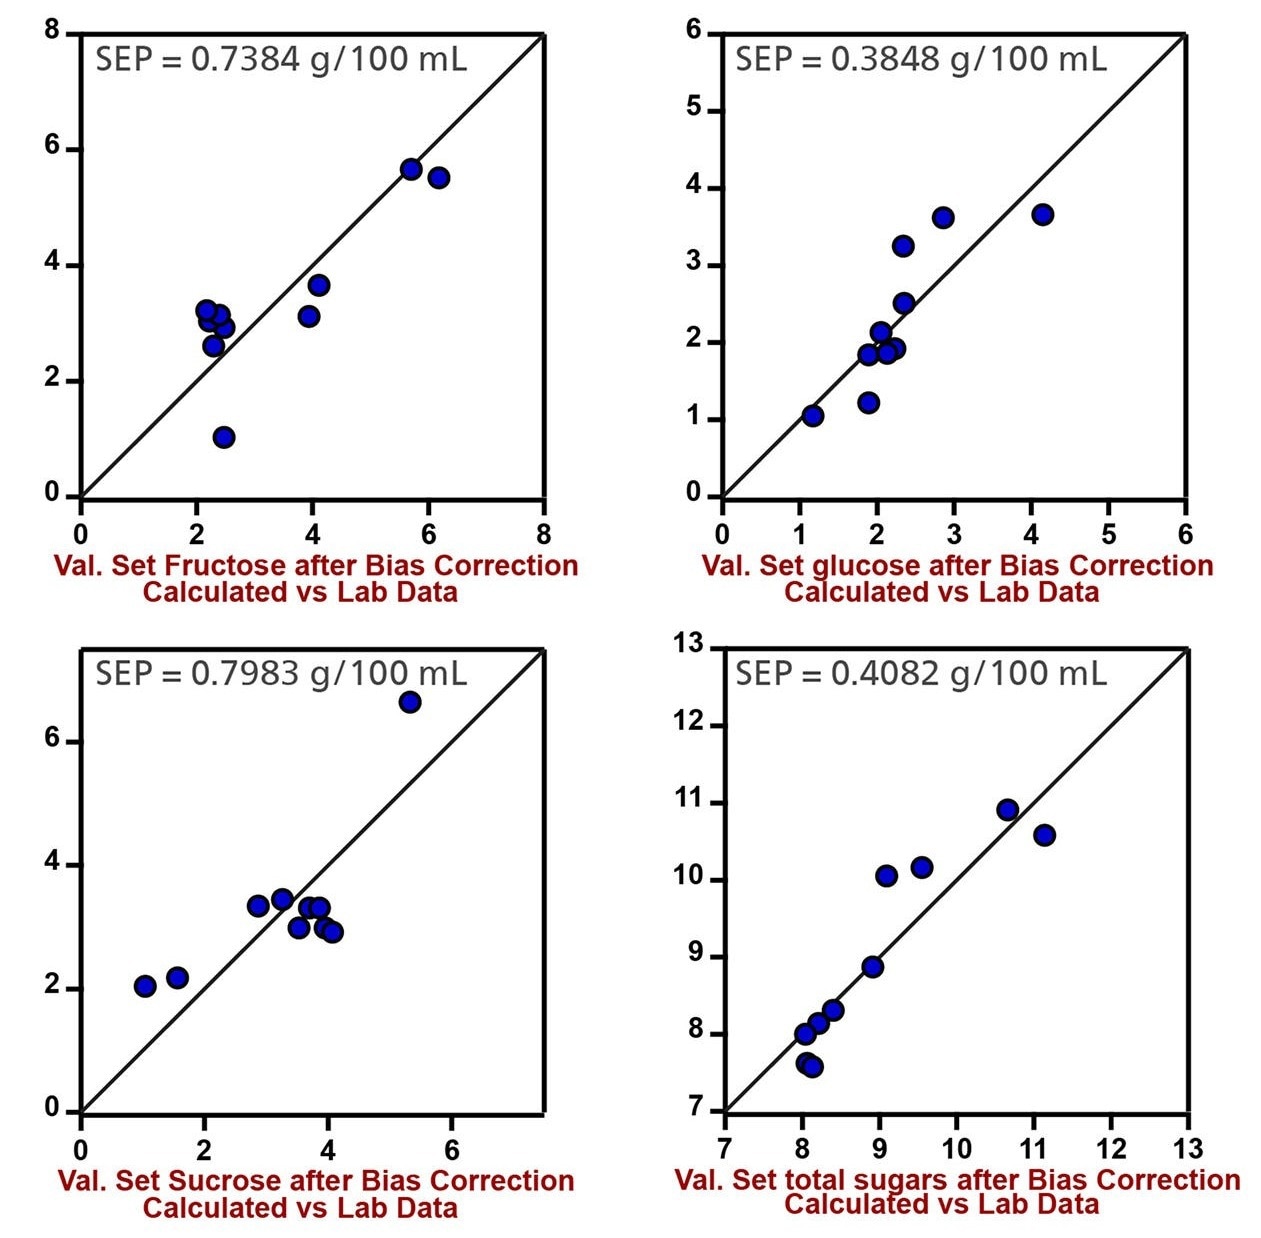
Figure 7. Validation plots of fructose, glucose, sucrose, and total sugars in fruit juices 1 to 10 with SEP (Standard Error of Prediction). Image Credit: B&W Tek
Conclusion
This article showcases the ability to determine glucose, fructose, sucrose, and total sugars in juices using near-infrared spectroscopy. This technique offers a fast and highly accurate alternative to conventional methods, without the need for specialized training, chemicals, or sample preparation.
NIRS presents a viable alternative to standard methods like liquid chromatography (as presented in Table 2).
Table 2. Time to result overview for the different sugars commonly analyzed in juices. Source: B&W Tek
| Parameter |
Method |
Time to result |
| Glucose, Fructose, Sucrose |
Ion chromatography |
5 min (preparation) + 40 min (IC) |
| Brix |
Refractometer |
1 min |

This information has been sourced, reviewed and adapted from materials provided by B&W Tek.
For more information on this source, please visit B&W Tek.