Rare earth elements (REEs) are vital in the production of high-specification electronic devices, including computer components, LEDs, smartphones, catalysts in electric motors (automotive), engines or petroleum refinement, and high-specification alloys.

Image Credit: ShutterShock:Phawat
Once a year, nearly 240 million tons of rare earth metals are produced with over half (140 M tons) sourced from China, 30 M tons from Myanmar, and huge reserves from Russia, Vietnam, and India, while smaller deposits in Australia, North America, and sub-Saharan Africa are being evaluated for economic viability.
The discovery of REEs requires the cost-effective and quick screening of survey samples for REE content, as a high-resolution survey area would demand the analysis of hundreds or thousands of samples a day.
The conventional method of inorganic analysis of geological survey samples requires acid digestion. There are a variety of different approaches that may be required, depending on rock/mineral composition, which has time and safety implications, requires large volumes of acid, and produces extensive chemical waste. However, a worldwide push towards more sustainable operations with a reduced chemical footprint means that this approach is no longer a viable option
When it comes to determining bulk/major composition, a large proportion of mining discovery samples tend to already be routinely fused into beads for XRF analysis. Laser ablation (LA) of these fused beads, however, would bypass the need for acid digestion and minimize waste and resource consumption.
Formerly considered a labor-intensive, low-volume technique, LA-ICP-MS has undergone a transformation. The utilization of the LaserTRAX laser ablation sample introduction system by Elemental Scientific Lasers (ESL) in conjunction with PerkinElmer’s NexION° 5000 Multi-Quadrupole ICP-MS now presents an exceptional blend of automation, rapid sample-to-sample loading, and accurate analysis for minor and major elements contained within these fused beads.
Experimental
Methodology
The NexION 5000 ICP-MS seamlessly interfaces with the LaserTRAX system through a simple push-fit connection and has several unique features that enable the accurate analysis of laser-ablated samples.
The powered interface controls and improves the transport of ions into the ICP-MS for high sensitivity, thereby enabling lower detection limits and enhanced precision for minor elements.
It is important to note that this improved transport does not compromise its ability to quantify major elements as the proprietary Extended Dynamic Range (EDR) capability adjusts the degree of attenuation on a mass-by-mass basis.
Additionally, the NexION 5000’s high-duty cycle provides a data acquisition rate of 100,000 points per second, while four gas channels integrated with a Dynamic Reaction Cell (DRC) offer excellent interference removal.
For this application, the LaserTRAX was utilized to directly examine XRF beads made from REE ore samples. The XRF beads have been produced routinely and examined for bulk or significant element composition of ores before they are sent for processing.
Being able to make use of the same beads for both XRF and LA-ICP-MS analysis cuts down on sample preparation and removes the need to utilize huge amounts of acids, which has advantages for both human health and the environment.
LaserTRAX is a laser ablation instrument that has been specifically designed to cater to high-throughput, automated analyses, accommodating a daily workload of up to 1200 samples. It operates on a swift 60-second analysis time per sample. It features integrated components like a barcode scanner, a sample-handling robot, and a laser ablation system. These seamlessly interface with the NexION ICP-MS platform — in this case, a NexION 5000 Multi-Quadrupole ICP-MS.
The parameters utilized for analysis on the LaserTRAX-NexION 5000 LA-ICP-MS solution are given below in Table 1.
Table 1. Parameters for LaserTRAX system and NexION 5000 ICP-MS. Source: PerkinElmer
| |
Parameter |
Value |
| LaserTRAX |
Laser Wavelength |
193 nm |
| He Sample Gas |
0.8 L/minute |
| Fluence |
8 J/cm2 |
| Repetition Rate |
20 Hz |
| Spot Size |
100 μm |
| NexION 5000 |
Plasma Flow |
16 L/minute |
| Auxiliary Flow |
1.2 L/minute |
| RF Power |
1200 W |
| Nebulizer |
PFA |
| Nebulizer Gas Flow |
0.35-0.4 L/minute (Tuned for 1.5% oxides) |
| Spray Chamber |
SilQ cyclonic |
| Injector/Torch |
SilQ one-piece torch with 2 mm injector |
| Sample Flow Rate |
0.8 L/minute |
| Cones |
Pt (Sampler and Skimmer)
Hyper-Skimmer with OmniRing used in extraction mode |
| Analysis Mode |
Reaction (DRC) with NH3 and Standard |
Samples
Using a glass reference standard (NIST610), the NexION 5000 ICP-MS was tuned for maximum sensitivity. The team was able to successfully obtain an U/Th ratio of 1 and a Th0/Th oxide ratio of less than 1%.
Blanks and standards comprised a blank fused bead and five standards. These standards were matrix matched to the ores by fusing 0.25 g of the CRM OREAS 20a (which was not measured in this experiment) into Li-tetraborate, along with the standard and 1000 ppm Ta used as an internal standard.
OREAS 20a was selected due to its minimal concentration of REE elements, while still yielding the intended effect of mirroring the ablation characteristics observed in the samples analyzed as part of this study.
The samples were made by combining 1.25 g of sample into a Li-tetraborate bead, supplemented by a spiked Ta internal standard at a concentration of 1000 ppm.
The samples were made up of six reference materials (Table 2) and 24 blank fusions which were placed between the CRM samples to create a large batch size; the blanks, standards, and reference materials were run in sequence 24 times.
The sample-to-sample analysis time was offered an average of 75 seconds, thereby making an analytical run in excess of 14 hours and comprising around 700 analyses.
Table 2. CRM samples and sample matrix. Source: PerkinElmer
| Sample |
Rock Type |
| OREAS 25a |
Soil |
| OREAS 100a |
Uranium Bearing Ore |
| OREAS 101b |
Uranium Bearing Ore |
| OREAS 106 |
High Grade Uranium Reference Material |
| OREAS 120 |
Uranium Ore |
| OREAS 124 |
Uranium Ore |
Results and Discussion
CRM Recovery
In the beginning, all elements were quantified in MS or MS Standard mode utilizing correction equations where essential, and percent recoveries were identified for every reference sample. Table 3 displays the averaged recoveries of 27 measurements over a period of 14 hours.
Only the recoveries of elements inside the calibration range are reported. The majority of the recoveries are made within 10% of the given CRM values, with some exceptions. But the value for Gd is constantly low in the existence of high Ce (OREAS 100a, 100b, 106) (above 500 ppm).
Table 3. % Recovery of REEs in a range of rock reference standards prepared as Li-tetraborate fused discs. Source: PerkinElmer
| Recovery % |
| Sample |
La (139) |
Ce (140) |
Pr (141) |
Nd (143) |
Sm (147) |
Eu (153) |
Gd (155) |
Tb (159) |
Dy (163) |
Ho (165) |
Er (166) |
Tm (169) |
Yb (172) |
Lu (175) |
| OREAS 25a |
99% |
95% |
|
90% |
|
|
94% |
|
93% |
99% |
97% |
99% |
98% |
98% |
| OREAS 100a |
98% |
98% |
94% |
90% |
105% |
104% |
86% |
99% |
91% |
99% |
94% |
103% |
98% |
103% |
| OREAS 101b |
|
94% |
88% |
84% |
89% |
99% |
85% |
101% |
86% |
101% |
90% |
122% |
95% |
120% |
| OREAS 106 |
94% |
101% |
87% |
91% |
92% |
92% |
87% |
90% |
92% |
97% |
94% |
95% |
100% |
100% |
| OREAS 120 |
110% |
104% |
|
106% |
|
115% |
103% |
|
108% |
112% |
- |
|
109% |
|
| OREAS 124 |
101% |
100% |
|
97% |
|
106% |
96% |
|
98% |
101% |
96% |
|
103% |
129% |
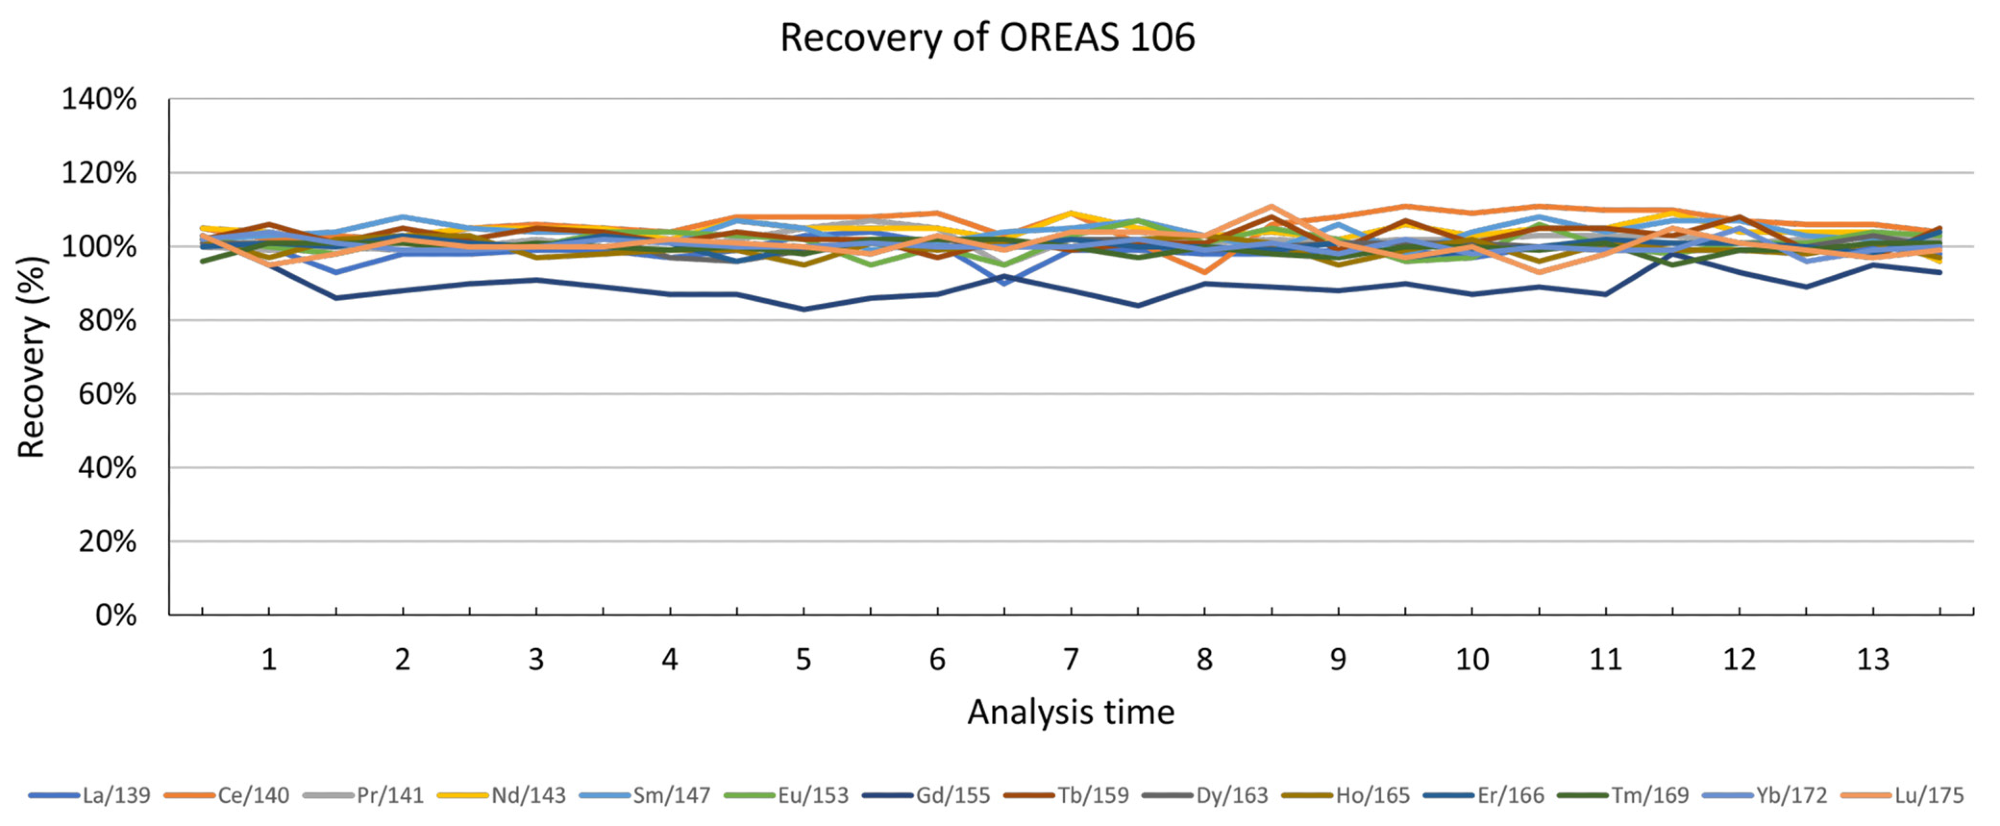
The stability of the analysis is displayed in Figure 1, where the repeated restoration of 27 measurements of one of the CRM materials (OREAS 106) is plotted over a 14-hour analysis period. From these results, it can be concluded that all recoveries are inside ±20%, with a majority of the recoveries happening inside 10%.
The exclusion is Gd, where the recoveries are more consistently low but still inside the acceptable ±20%, thereby corresponding to the earlier observation that recoveries for Gd are low in the existence of high Ce.
This indicates that the interference of CeO on Gd is being overcorrected, particularly when there is a high Ce content. This therefore means that a more reliable interference correction is required, by either mass shifting the analyte of interest, Gd, away from the interference or removing the CeO interference altogether.

Figure 1. Recovery for REEs in OREAS 106 ore reference material over 27 replicates over a period of 14 hours. Image Credit: PerkinElmer
Interference Corrections for Higher Level La and Ce Ores
When quantifying REEs, oxygen is often used as a cell gas to eliminate the oxide interferences from light-mass REEs on higher-mass REEs, through a reaction with oxygen to form REEO2+ ions, out of the interferences. But this does not work when quantifying Gd in the existence of Ce.
This is because Gd+ reacts with O2 to form GdO+, while CeO+ (which to a certain extent forms in the plasma) reacts with O2 to create CeO2+ at various masses where GdO+ ions reside.
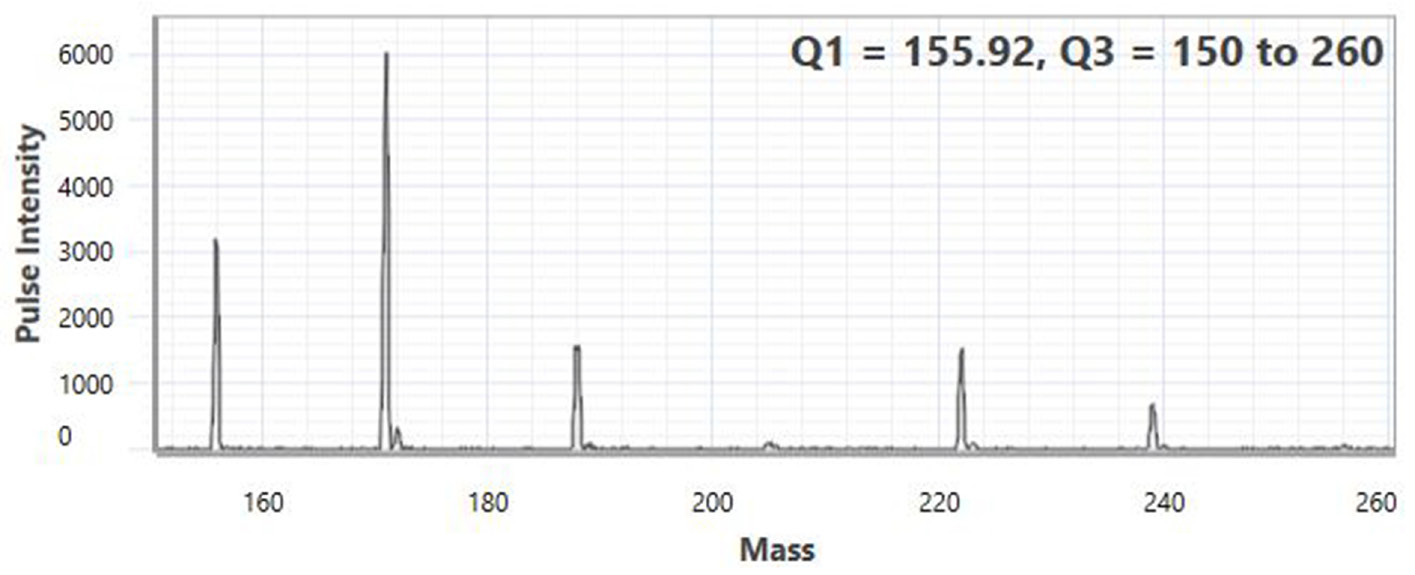
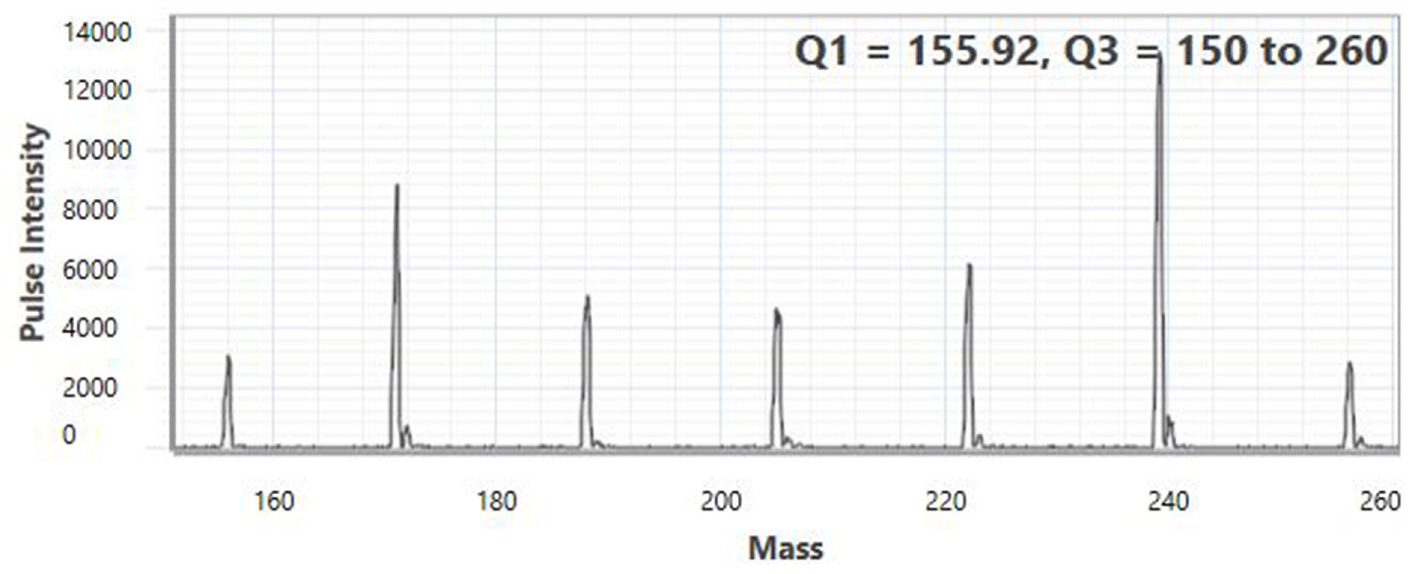
However, if pure ammonia (NH3) was used in conjunction with the NexION 5000 ICP-MS, Gd could be quantified interference-free in Mass Shift mode. Gd+ reacts with ammonia making numerous GdNH (NH3) x+ clusters (Figure 2), with the intensity of the cluster based on the NH3 flow.
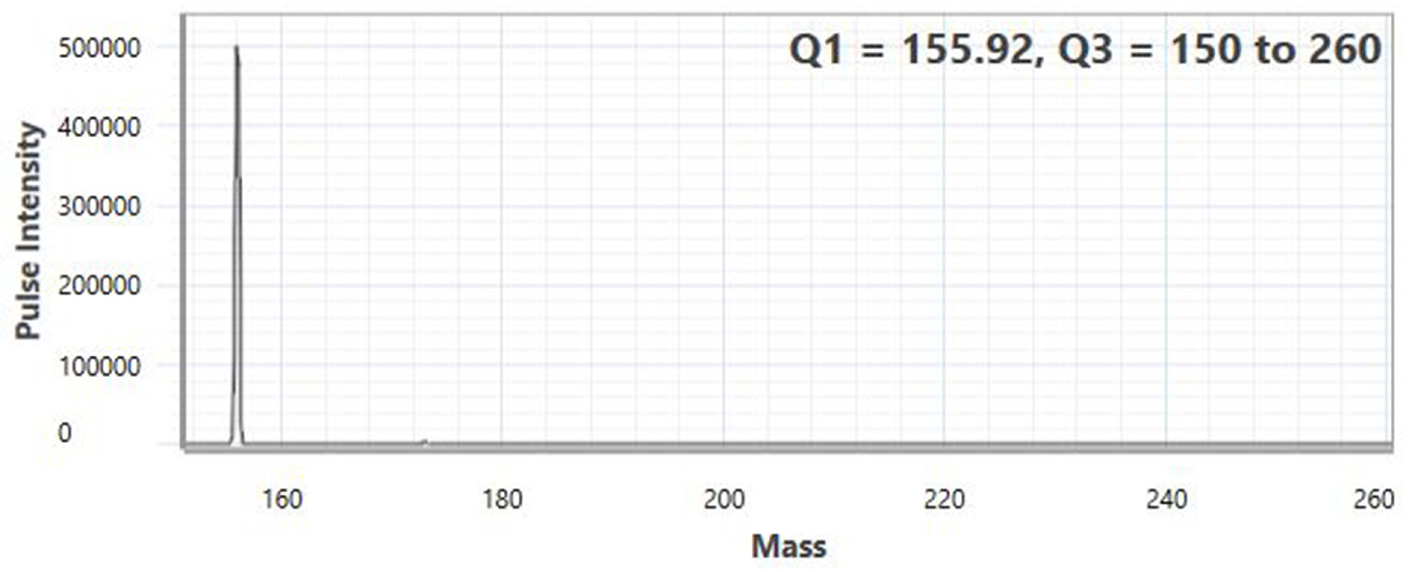
The sensitivity of the clusters at greater masses rises with a higher reaction gas flow (Figure 3), but CeO+ does not react so readily, as displayed in Figure 4. Consequently, Gd could be quantified interference-free at a range of various masses where the GdNH (NH3)x+ clusters have been developed.

Figure 2. Product ion scan of 1 ppb Gd creating several GdNH (NH3)x+ clusters with 0.4 mL/min of NH3 flow. Image Credit: PerkinElmer

Figure 3. Product ion scan of 1 ppb Gd creating several GdNH (NH3)x+ clusters with 0.6 mL/min of NH3 flow. Image Credit: PerkinElmer

Figure 4. Product ion scan of 100 ppb CeO showing minimal reaction with NH3 at 0.4 mL/min flow. Image Credit: PerkinElmer
To assess the ability to examine Gd in a high Ce matrix utilizing Reaction mode with NH3, 1.25 g of an OREAS 20a reference material was spiked with 10,000 ppm Ce and then fused into a bead to imitate a high-Ce REE ore.
OREAS 20a was used due to the low levels of REE elements in the CRM, thereby allowing the effect of the added Ce to be noted. NH3 was added to the DRC cell and optimized to a flow rate for the best sensitivity for each cluster, as shown in Figures 3 and 4.
The recovery outcomes of Gd for Standard mode versus two Gd NH3 clusters, in the existence of high Ce, are displayed in Table 4. In this example, under Standard mode and without the inclusion of a reaction gas (Gd 156/156 in MS/MS mode), no correction equation was applied to eliminate the Ce0 interference from 6Gd.
From Table 4 (column 1), it is clear to see that the recovery exceeds 150% for " 6Gd in standard mode with no correction equation. In a real-life screening scenario, this would mean that the Gd content of an ore would be overestimated, giving an inaccurate impression of the ore's economic viability.
Using NH3, the sample was re-examined in the DRC to mass-shift Gd away from the CeO interference (Table 4, columns 2 and 3), both ’ 6Gd and ' 8Gd returning results < 10% from the certified value (n=3), an outcome that is reproducible over both short- and long-term analyses. This ensures that a precise profile is identified for all REEs in every sample.
Table 4. % Recovery of REEs in a range of rock reference standards prepared as Li-tetraborate fused discs. Source: PerkinElmer
| |
Gd 156/156 MS/MS |
Gd 156/171 Mass Shift |
Gd 158/173 Mass Shift |
| Measured Conc (ppm) |
12.1 |
6.32 |
6.71 |
| Certified Conc (ppm) |
6.78 |
6.78 |
6.78 |
| % Recovery |
178 % |
93 % |
99 % |
| Precision |
0.67% |
1.21% |
1.13% |
Conclusion
Ultimately, a LaserTRAX laser ablation sample introduction system linked to the NexION 5000 Multi-Quadrupole ICP-MS allowed for the direct analysis of thousands of fused beads a day without the need for acid digestion.
In several cases, the fused beads had already been produced for XRF analysis, so LaserTRAX immensely enhances the efficiency of the sample preparation workflow, with recoveries in the 100% ± 10% range for available screening of REE-bearing ores.
The NexION 5000 ICP-MS proved to be an ideal tool for this analysis, thereby enabling significant elemental analysis using Extended Dynamic Range capabilities and trustworthy, regulated reactions for the best interference removal.
The NexION is a sensitive and robust detector suitable for the routine measurement of ultra-trace impurities and major components in solid matrices, with the ability to rapidly switch to Reaction with 0, and NH, modes to resolve analytical issues.
The interference removal described within this article is easy to implement and demonstrates consistent performance across the entire range of analyte/interference concentrations, making it well-suited for utilization in a high-throughput workflow setting.
References
- “LaserTRAX-NexION 5000 ICP-MS - Your Fully Automated Sample Introduction, Laser Ablation Solution”, PerkinElmer Flyer, 2022.