This article is based on a poster originally authored by Sandro Spiller, Oliver Buettel, and Siqi Sun.
The potential of a new method for storing electrical energy, combined with increasing fossil fuel prices, offers electromobility the possibility of a long-term future in individual mobility. The future of electric drive systems could depend on batteries, considering the advantages of lithium-ion batteries (LIBs) like costs, weight, and energy density.
Requirements for LIBS are continually looking to increase operational lifetimes and improve capacity. The raw materials must be kept up by consistently providing higher quality.
Li2CO3, with a purity of 99.5%, is currently considered battery grade. The industry is searching for raw materials with purities equal to or greater than 99.9%. Demands for increased purity of the raw materials used in batteries mean that the analytical technique must guarantee sensitivity and matrix compatibility.
 Download the Poster
Instrumentation
The inductively coupled plasma optical emission spectrometry (ICP OES) provides strong, rapid, multi-element analyses for various types of specimens. It is a favored instrument for finding trace impurities in lithium battery materials. For this examination, a high-resolution (HR) ICP-OES, the PlasmaQuant 9100 Elite, was utilized in trace elemental analyses in Li2CO3.
Extremely high resolution combined with exceptional plasma strength and increased instrument sensitivity provides the advantage of interference-free analyses of all the analytes examined in the low to sub-ppb range.
Excessive amounts of lithium ions in the plasma can create ionization interferences, resulting in false-positives in easily ionizable elements (EIE). This requires the calibration standards to be matrix-matched. To validate the analytical method’s suitability and assess instrument performance, analyte recovery, and extended stability tests were completed.
Instrument Settings
PlasmaQuant 9100 Elite ICP-OES completed the analyses. The instrument settings and the specimen introduction components were chosen to provide lower detection limits for trace elements in high salt-containing matrices.
The instrument had a glass concentric Seaspray™ nebulizer, a 2.0 mm inner diameter injector tube, and a cyclonic spray chamber with a dip tube installed. Increasing the space between the injector and plasma reduces the probability of salt deposits on the injector tip.
Sample Preparation
Working standards were formulated by serial volume/volume dilution in polypropylene of a multielement standard solution (Sigma Aldrich, 10 mg/L). All calibration standards and the blank solution (0.01 to 5.0 mg/L) were matrix-matched (5.0% (w/v) Li2CO3) and acidified (pH < 1) with concentrated (w ≥ 65%) nitric acid. A spiked (0.1 mg/L) blank solution was used as a specimen and for quality control.
The blank solution was prepared by dissolving 2.5 g of Li2CO3 in 10 mL DI water and adding 6 mL of concentrated nitric acid dropwise to prevent vigorous foaming. Lastly, the solution was filled to 50 mL with DI water and sonicated (5 min) to eliminate residual carbon dioxide.
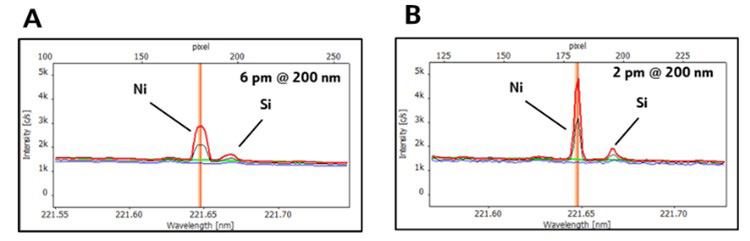
Figure 1. Application advantage of high-resolution spectra (red: sample, black: spike, blue: blank, and baseline correction (green)). Interferences of the matrix components can be well separated from the analyte Ni (A and B) using HR Array optics (B). In contrast, employing instruments (A) with lower resolution results in spectral overlaps and broadening of signals. Image Credit: Analytik Jena US
Results and Discussion
The PlasmaQuant 9100 Elite provides exceptional sensitivity for many of the technical features. The four-wind coil combined with counter gas technology offers extended analytical zones in axial observation mode, resulting in as many signals as possible in ICP-OES.
The spectral resolution of 2 pm @ 200 nm (Figure 1) makes using difficult correction algorithms like the inter-element correction outdated.
This provided dependable quantification without the interference of trace elements by accessing the sensitive emission lines and highly visible peaks with exceptional sensitivity.
Table 1. Instrumental (IDL) and method detection limits (MLD) and spike recovery rates (0.1 mg/L) for certain elements in 5% (w/v) Li2CO3 solution. Source: Analytik Jena US
| Element/Line |
IDL [μg/L] |
MDL [μg/kg] |
Spike Recovery |
| Al 396.152 |
0.9 |
0.018 |
99 |
| Ca 315.887 |
1.1 |
0.022 |
97 |
| Cu 327.396 |
0.5 |
0.010 |
100 |
| Fe 259.940 |
0.3 |
0.006 |
99 |
| K 766.481 |
0.7 |
0.014 |
99 |
| Mg 280.271 |
0.1 |
0.002 |
100 |
| Mn 259.372 |
0.1 |
0.002 |
99 |
| Na 589.592 |
0.6 |
0.012 |
97 |
| Ni 221.648 |
0.1 |
0.002 |
99 |
| Pb 220.353 |
2.2 |
0.044 |
98 |
| S 180.672 |
7.9 |
0.158 |
100 |
| Si 251.611 |
1.8 |
0.036 |
99 |
| Zn 206.200 |
0.2 |
0.004 |
99 |
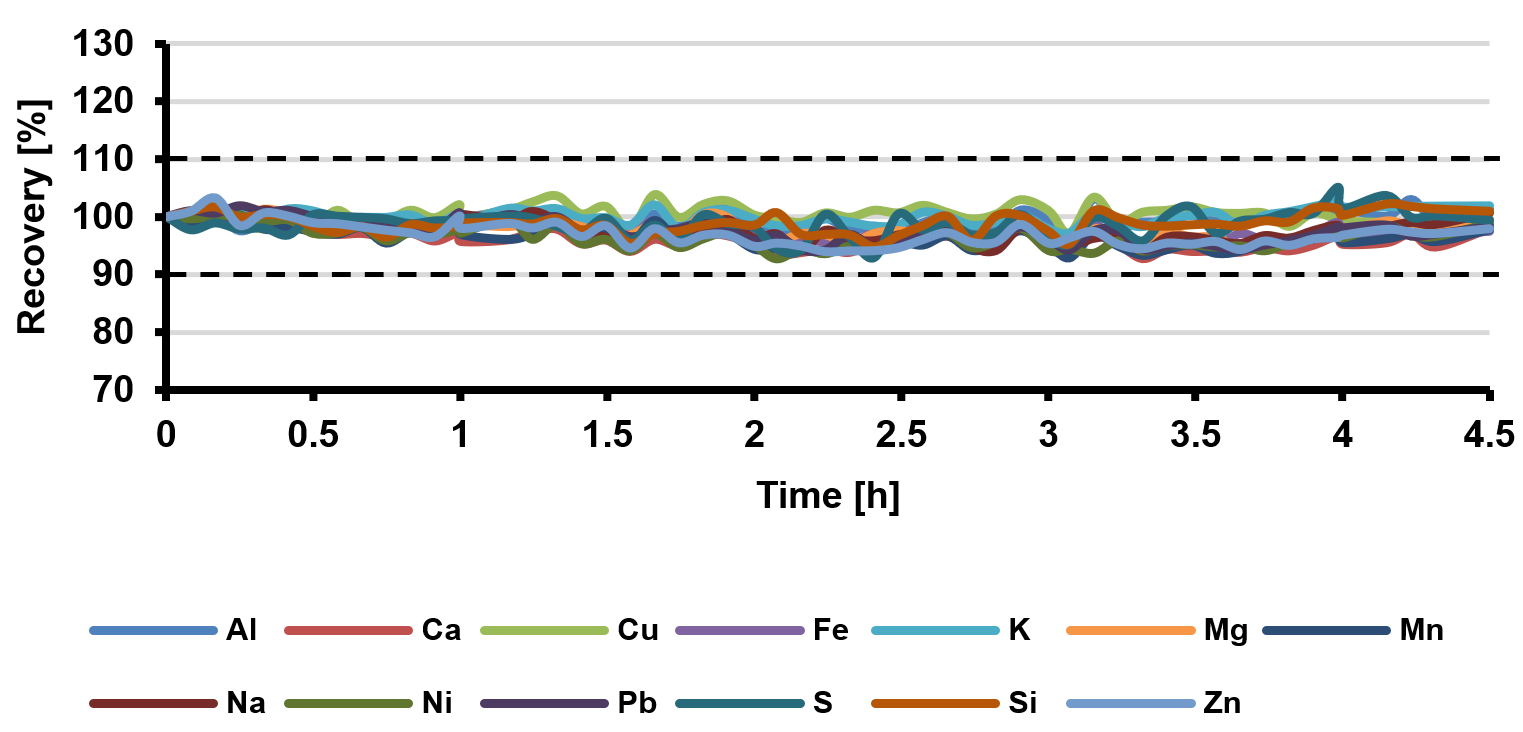
Figure 2. Percentage recoveries of spiked analytes (0.1 mg/L) in a 5% (w/v) Li2CO3 solution throughout a 4.5-hour sequence. RSD values were below 2.2% for all elements. Image Credit: Analytik Jena US
Conclusions
The discussed technique meets the stability, sensitivity, and accuracy needed to complete the analyses of battery-grade Li2CO3 samples. The innovative torch design of PlasmaQuant 9100 Elite prevents salt deposits on vital glassware parts from forming and guarantees ease of torch handling throughout maintenance.
The PlasmaQuant 9100 Elite provides high sensitivity and the ability to dilute high salt-containing matrices, reducing downtime while meeting the examined product’s specific requirements.
Download the Poster

This information has been sourced, reviewed and adapted from materials provided by Analytik Jena US.
For more information on this source, please visit Analytik Jena US.