Carus LLC has developed and produced a series of diverse, industry-leading catalyst products that are frequently employed in industrial abatement systems.1
The CARULITE® 500 is one of its most popular products. It is widely employed in catalytic oxidizer (CatOx) abatement systems to mitigate a range of volatile organic compounds (VOCs) and hazardous air pollutants (HAPs) emitted through the exhaust of industrial ducts and stacks.
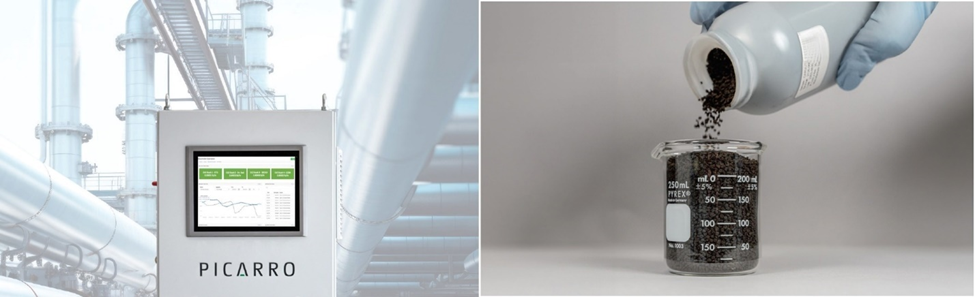
Figure 1. Picarro’s EtO Continuous Emissions Monitoring System (CEMS)and Carus’s CARULITE® 500 granules. Picarro’s Cavity Ring-Down Spectrometer analyzers were used to evaluate the remarkable destruction efficiency of CARULITE® 500. Image Credit: Picarro and Carus LLC.
CARULITE® 500 is an especially prominent catalytic oxidizer system designed for ethylene oxide (EtO, EO) abatement.
While CARULITE® 500 is widely regarded as a highly efficient product throughout the commercial sterilization industry, 2024 revisions to the EPA’s EtO NESHAP (40 CFR Part 63, Subpart O) guidance and the creation and introduction of Quality Assurance Procedure 7 (Procedure 7) and Performance Specification 19 (PS-19) have imposed considerably stricter stack emissions standards for any organization looking to ensure federal compliance for commercial sterilizers utilizing EtO.2,3
Regulatory authorities in the United States have developed and implemented standards designed to limit stack emissions to levels as low as 0.015 lb per hour over a rolling 30-operating-day period, requiring destruction and removal efficiencies of up to 99.99%.
Compliance is evaluated via maintaining a continuous maximum 10 ppb stack EtO concentration or demonstrating up to a 99.99 % abatement system destruction efficiency (South Coast AQMD, Proposed Amended Rule 1405).4
This case study from Carus and Picarro, Inc. (Picarro) evaluates and explores destruction efficiency testing carried out via the use of Picarro’s EtO Cavity Ring-Down Spectrometer (CRDS) technology on Carus’s CARULITE® 500 catalyst media.5,6
Picarro’s measurement technology offers unparalleled accuracy, sensitivity, and stability. It can achieve detection limits of less than 0.2 parts per billion (ppb) in measurement averaging intervals of two seconds, maintaining a dedicated calibration drift of less than 0.2% of span over seven days.
These characteristics make Picarro’s measurement technology ideal for studies that require precise characterization and the confirmation of extremely high destruction efficiencies.
This article's testing and measurement process was conducted in a laboratory setting. An EtO standard was blended to a range of concentrations between 100 ppm and 1000 ppm to simulate the kinds of levels that catalytic oxidizer systems may encounter while engaging in active batch sterilization.
To validate the flow of process gas to the analyzer, a tracer method employing CH4, H2O, and CO2 was used.
The outlined results show that the CARULITE® 500 system exceeds even the most rigorous regulatory standards in terms of effluent concentrations and destruction efficiency, with average outlet concentrations of 0.2 ppb across inlet concentrations and an average observed destruction efficiency of 99.99988%.
Background
EtO is widely employed as a sterilant gas and represents a popular chemical precursor/intermediate in food processing, refining, and medical device sterilization.7,8,9
Its ability to comprehensively penetrate a wide range of materials without causing damage has made it an indispensable tool for sterilizing sensitive medical equipment, such as spinal cord stimulators or pacemakers, that cannot withstand alternative approaches like steam or irradiation.
EtO is such an effective sterilant that it is employed to sterilize over 50% (amounting to over 20 billion) of all medical devices sold annually in the United States.
This cornerstone technology is essential for safely sterilizing lifesaving medical equipment, but the US EPA has recently highlighted EtO’s carcinogenic properties.10 This has increased scrutiny and growing concerns from industry workers, regulatory bodies, and community organizations.
These concerns have led to introducing a series of new regulatory measures designed to mitigate EtO emissions and reduce occupational exposure. These measures primarily originate from the United States Environmental Protection Agency (US EPA) and have either already been enacted or are anticipated to be implemented between 2024 and 2026.
Recent and upcoming regulatory measures include the revised EtO NESHAP, PS-19, and Procedure 7 for continuous source emissions monitoring, and also the Federal Insecticide, Fungicide, and Rodenticide Act (FIFRA), which is based on the Proposed Interim Decision (PID) addressing workplace and lifetime exposure.2,3,11
Several local, statewide, regional, and international authorities have implemented their own measures within their respective territories. These measures meet or exceed the requirements outlined within the US EPA guidelines.4
These strict regulatory rules and measures have prompted a widespread reassessment of emissions containment and abatement strategies, both in the United States and internationally.
Companies using EtO are increasingly urged to implement emissions management systems, specifically systems that use state-of-the-art abatement materials centered around the requirements for regulatory compliance.
Industries looking to meet EPA and other international requirements ahead of the 2024–2026 deadlines must proactively upgrade to these systems and materials and employ intelligent monitoring practices throughout their processes.
Methods and Materials
Carus CARULITE® 500
Carus has been supplying groundbreaking chemical solutions for over 100 years, centered around its Starved Rock County, IL base. The company’s CARULITE® 500 catalyst (Figure 1) is employed worldwide in abatement systems designed for ethylene oxide destruction.
When employed within appropriately engineered systems, this catalyst effectively converts EtO to carbon dioxide and water at 150 °C, ensuring rigorous regulatory discharge standards are strictly adhered to.
Picarro EtO Systems and Solutions
Very few EtO instruments can detect limits that can confidently confirm the “four nines” of destruction efficiency (99.99%) when working with EtO concentrations between 100 and 1000 ppm. Carus has, therefore, collaborated with Picarro Inc. for over 25 years due to Picarro’s status as an industry-leading analytical instrumentation provider.
CRDS and spectrometer systems from Picarro Inc. measure HAPs and greenhouse gases at trace levels worldwide, typically seeing widespread use in industry, academia, and government agencies.
Picarro’s comprehensive suite of EtO systems allows industries to monitor up to 25 points within the workplace. This may include continuous emissions monitoring at stack outlets, perimeter monitoring across a fence line or other boundary, or evaluating health risks and other regulatory compliance considerations around the facility.
These systems are available via leased managed service agreements, assuring facility managers and the wider workforce that these systems - managed by Picarro’s team of Environmental Systems experts - will always be well-maintained, up-to-date, and compliant.
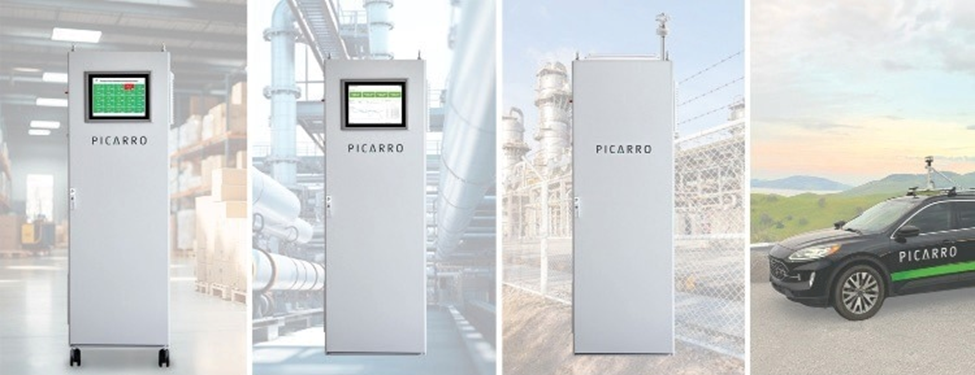
Figure 3. Picarro EtO Systems, all of which feature Cavity Ring-Down Spectrometers for rapid, sensitive EtO reporting to aid industries in achieving and maintaining regulatory compliance. Image Credit: Picarro
Picarro Cavity Ring-Down Spectrometer
Picarro’s stack EtO instrument confidently guarantees a minimum detection limit of 0.25 ppb, representing unmatched stability and selectivity for EtO. This system stands out throughout the industry due to its rapid response and one-second measurement intervals.
The instrument also accurately measures CH4, CO2, and H2O concentrations, enabling validation of destruction efficiencies via passive and stoichiometric-ratio tracer methods.
All Picarro instruments are subjected to scrupulous quality assurance testing to ensure they can effectively handle complex gas matrices, whether anticipated at the stack, in workplace environments, or in ambient air.
This combination of accuracy and quality affords industries a powerful tool for comprehensively evaluating facility health and risk while ensuring regulatory compliance.
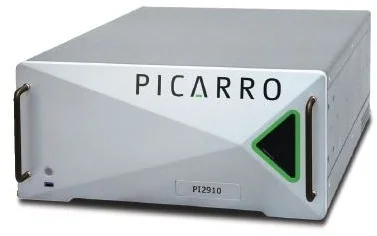
Figure 4. Picarro Cavity Ring-Down Spectrometer EtO Instrument, found at the heart of all Picarro EtO systems and solutions. Image Credit: Picarro
Testing Apparatus
The reactor column testing apparatus from Carus (Figure 5) is designed to simulate commercially available catalytic oxidizers. A 150 °C air preheater in the device preheats the catalyst bed before encountering the EtO.
Air is then maintained at 150 °C as it moves downward through the packed bed of 102 g/120 ml of CARULITE® 500, secured by a refractory material.
The temperature of both components is regulated via setpoint rheostat and temperature controller systems, respectively. Continuous monitoring ensures that the temperature of the apparatus remains at 150° ± 20 °C. During warm-up, temporary temperature deviations are acceptable due to the exothermic reaction of EtO destruction.
The test outlined here was conducted with a flow rate of 15 liters per minute (l/minute). Two Alicat Scientific (Alicat) mass flow controllers offering dynamic ranges of 0–20 l/minute were used to direct sample air.
This was blended from an ultra-high purity zero air tank and a nominal 1000 ppm EtO tank (certified at 980.4 ppm ± 2% in air) to achieve EtO concentrations of approximately 100, 200, 500, and 1000 ppm at the reactor inlet.12
The Picarro instrument sampled the flow at 230 ml/minute downstream of the reactor, while any excess flow was vented to a fume hood.
Conditioning airflow was circulated through the rig at a rate of 15 l/minute during the reactor warm-up phase to ensure uniform reactor heating. To save zero gas, this process was undertaken via a bypass pump that pulled ambient room air through a second reactor inlet valve and exited through a three-way valve at the reactor exhaust.
Upon reaching the temperature set point, the inlet switched to zero air and the outlet switched to the Picarro. Testing began once the water concentration at the Picarro had fallen below 0.15%. This was controlled using a programmed sequence to achieve the desired concentration set points by adjusting the two mass flow controllers.
The total testing time was 2.5 hours, with each step lasting 15 minutes. This was done with ascending and descending phases to mitigate any memory effects that could impact the results.
The initial concentration of the zero air was utilized as a baseline ‘zero EtO’ state, then deducted from subsequent steps to normalize the experiment's outcomes.
It was important to ensure that the outlet signal accurately represented the effluent sample gas and was not impacted by a leak or other gas stream.
Prior testing by Picarro had confirmed the stability of trace-level CH4 below 200 °C in catalyst beds, so a conserved tracer (CH4) was introduced into the tank at a nominal 10 ppm concentration (certified at 9.5 ppm ± 2 %).
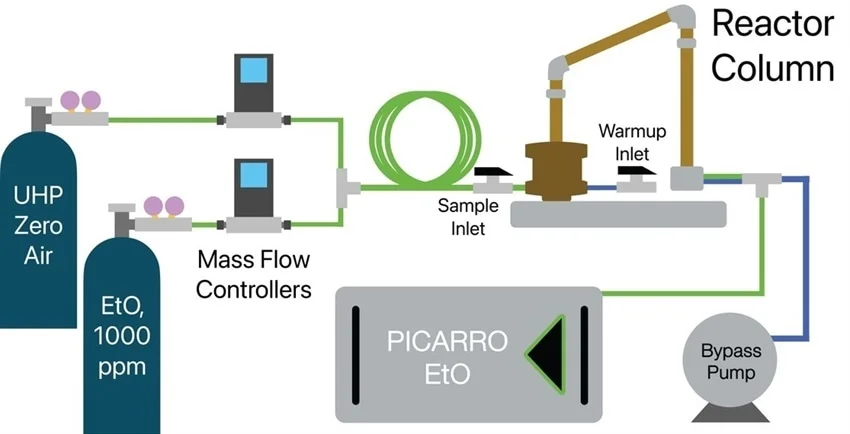
Figure 5. The experimental test apparatus design used a Carus test reactor column and a Picarro EtO Analyzer to measure the column effluent to confirm the destruction efficiency of the CARULITE® 500 catalyst, showing various warmup and sample pathways. Image Credit: Picarro
Results and Discussion
Destruction Efficiency
Figure 6 shows the inlet concentration expressed in parts per million, values derived from measured mass flow controller blending ratios, and the tank's known concentration.
The second Y axis shows observed outlet EtO concentrations in ppb units, representing a five-minute average value. Because a minimal amount of EtO passes through the reactor column, there is almost no discernible difference to the naked eye.
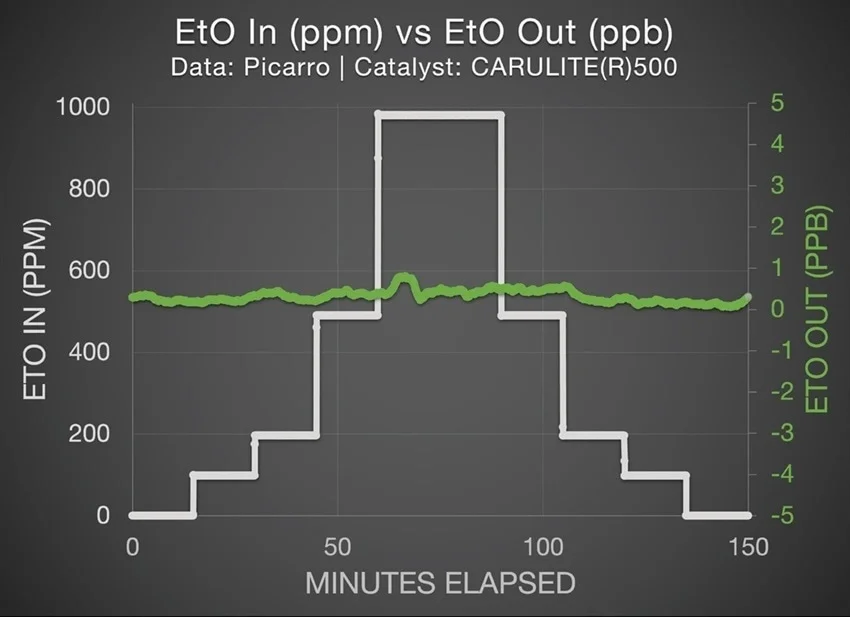
Figure 6. EtO in (ppm) and EtO out (ppb) of the test reactor column, indicating that virtually zero EtO reaches the Picarro analyzer despite very high inlet concentrations as high as ~1000 ppm. Image Credit: Picarro
An average of ascending and descending legs for each concentration level was taken to establish the mean value for a specific inlet concentration (Figure 7, green values).
It was noted that all EtO readings at the reactor outlet remain below 0.3 ppb. This discovery was especially noteworthy, considering that the inlet concentration reached almost 1,000,000 ppb at its peak.
An orange dashed line illustrated the instrument’s assured lower detection limit of 0.25 ppb. This confirms that two of the recorded concentrations fall below this guaranteed threshold.
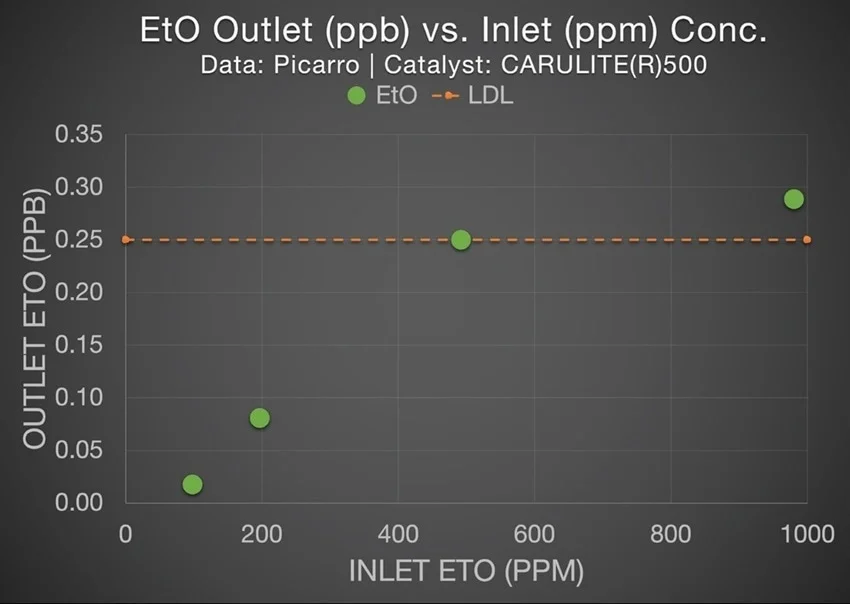
Figure 7. Average outlet EtO concentration in ppb as a function of inlet EtO concentration in ppm. Two outlet concentrations are so low as to fall below the guaranteed lower detection limit of the Picarro instrument. Image Credit: Picarro
Destruction efficiency for these four concentrations was assessed by dividing the observed corrected outlet EtO value by the inlet concentration, subtracting this from 1, and multiplying the resulting figure by 100. All of these calculated values exceeded 99.999%.
Figure 8 shows these values as both the observed destruction efficiency and the destruction efficiency as constrained by the lower detection limit (LDL) in instances where observed values fell below this threshold.
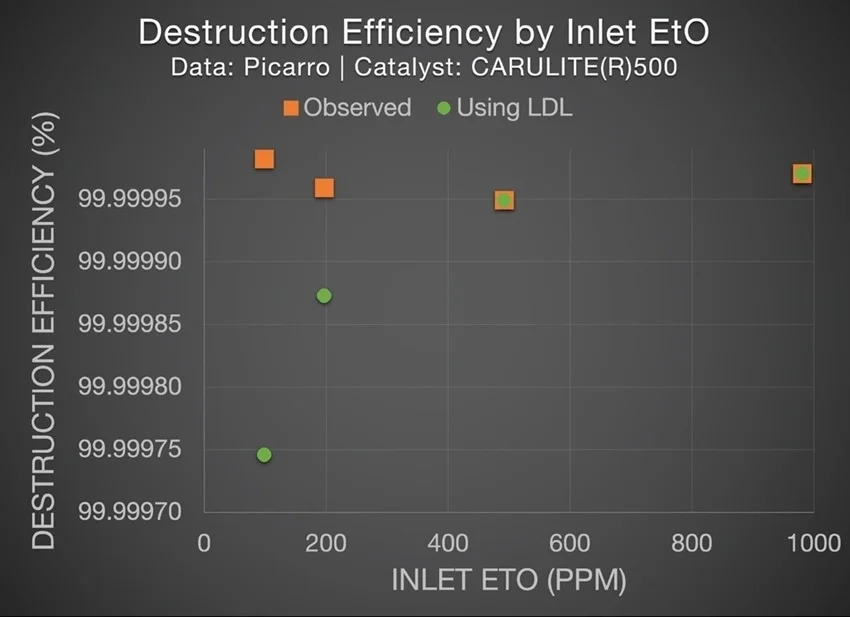
Figure 8. Destruction Efficiency at 100, 200, 500, and 1000 ppm inlet EtO concentrations. Constraining the observed efficiency by the official detection limit of the instrument slightly reduces the DE, as shown in the two green dots on the left, but still suggests incredible destruction efficiency above “five-nines”. Image Credit: Picarro
Table 1 summarizes the inlet, outlet, and destruction efficiencies.
Table 1. Inlet (ppm) and outlet (ppb) concentrations for the testing apparatus, with both the observed/implied destruction efficiency, and the destruction efficiency using the lower detection limit of the Picarro analyzer. Source: Picarro
| |
Inlet EtO (ppm) |
Outlet EtO (ppb) |
DE Obs (%) |
DE (%) 0.25 ppb LDL |
| Step 1 |
0* |
0** |
n/a |
n/a |
| Step 2 |
98.4* |
0.02 |
99.99998 |
99.99975 |
| Step 3 |
196.8* |
0.08 |
99.99996 |
99.99987 |
| Step 4 |
492* |
0.25 |
99.99995 |
99.99995 |
| Step 5 |
980.4* |
0.29 |
99.99997 |
99.99997 |
| Avg. DE |
-- |
-- |
99.999965 |
99.99988 |
*Inferred from mass flow controller blending and known tank value
**By definition, as this is used to characterize the zero
In this example, average destruction was observed as 99.999965%, while destruction efficiency using the analyzer's detection limit was found to be 99.99988%—greater than “five-nines” destruction efficiency.
Tracer Method and Stoichiometry
With high results and efficiency, it was deemed prudent to assess and confirm their validity independently. Two different methods made this possible.
Methane Tracer Proof
The ~1000 ppm EtO tank incorporates an approximately 10 ppm methane tracer gas (certified: 9.5 ppm ± 2%). Previous Picarro studies have shown that this is conserved below 200 °C in reactor columns.
Observing the value of this gas at the outlet makes it possible to confirm that EtO from the cylinder is passing through the reactor apparatus and that this is not being redirected elsewhere or escaping.
Figure 9 (thin purple line) illustrates the predicted CH4, while overlaid purple dots highlight the observed CH4 tracer. Because the methane was found to be preserved with near-perfect recovery, a solid line is used for the predicted value and dots for the observed value to easily distinguish between the two lines.
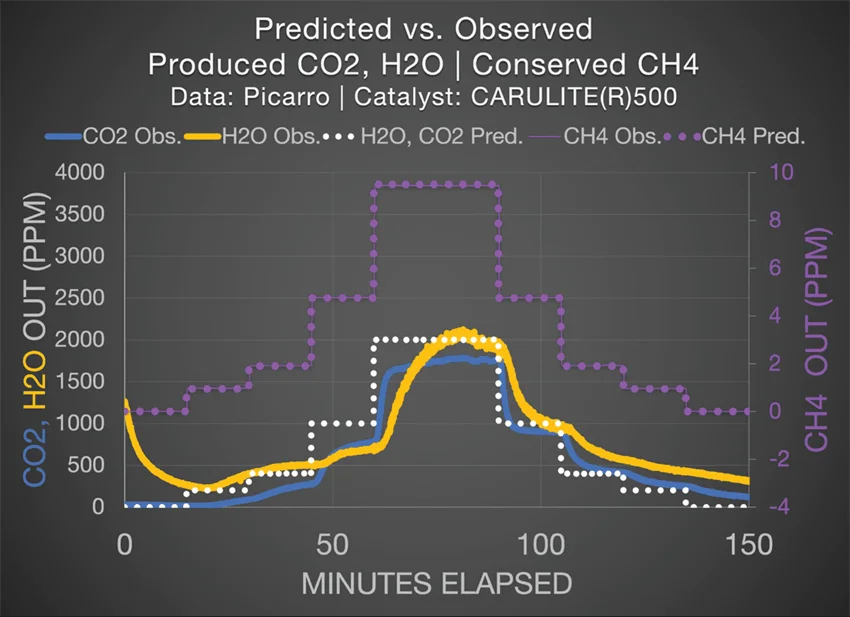
Figure 9. Expected vs observed CO2, H2O, CH4, showing H2O and CO2 latency effects. Image Credit: Picarro
Stoichiometric Proof
H2O and CO2 data were plotted alongside the CH4 data to further verify the experiment’s results. H2O and CO2 are expected to be produced at double the concentration of the inlet EtO, as shown via the white dotted line. This is in line with the following equation:
1 C2H4O + 5 ⁄ 2 O2 → 2 CO2 + 2 H2O
H2O and CO2 production consistently track the anticipated value near the expected stoichiometry. However, this was observed to shift slightly backward in time due to the tendency of water and carbon dioxide to adsorb and desorb from the catalyst media’s large surface area.
The validity of EtO destruction efficiency by the Carus catalyst media was further confirmed using the CH4 tracer and the H2O and CO2 stoichiometry methods outlined here.
Picarro EtO Technology and PS-19: Demonstrating Excellence in Compliance
It is vital that instrumented systems used for EtO CEMS monitoring are initially tested in a controlled laboratory environment to ensure compliance with the specific Interference, Measurement Error, and Level of Detection (LOD) performance tests outlined in PS-19.
The interference, measurement error, and level of detection (LOD) performance tests presented in this article evidence the suitability of Picarro equipment for evaluating the destruction efficiency of Carus catalyst media.
The testing conditions described here include concentrations of H2O, CO2, and CH4 that significantly exceed those depicted in the above test. These have been designed to capture ‘worst-case’ scenarios seen under the most conservative conditions while accounting for the somewhat elevated uncertainty response noted in the results when compared against the values inferred in Carus’ catalyst testing procedures.
Interference Response (PS-19 Section 11.1)
The interference test must be performed with all the interferent species (CO2, CH4, and H2O balanced in N2) present. The test can be run individually, resulting in less of an interference impact, or collectively to more closely resemble real-world matrices. The latter of these two approaches tends to be more difficult, however.
Figure 10 shows the outcomes of this assessment for the Picarro CEMS system EtO instrument for EtO (ppb). In this instance, all three interferent gases were tested, alternating between real-world ambient conditions and the highest elevated conditions specified by PS-19 CEMS: CO2 at 1.2% (12000 ppm), CH4 at 20 ppm, and H2O at 4.5%.
The mean difference between the elevated and ambient EtO is 1.44 ppb, significantly less than the 30 ppb threshold stipulated in PS-19 Section 13.5.1. This value is especially noteworthy when considering the simultaneous introduction of all three interferents at their maximum concentrations.
It should also be noted that manufacturers of technologies such as FTIR rarely provide this particular form of testing due to inherent performance challenges linked to thermal oxidation modules, optical filters, and simultaneous cross-talk correction algorithms.
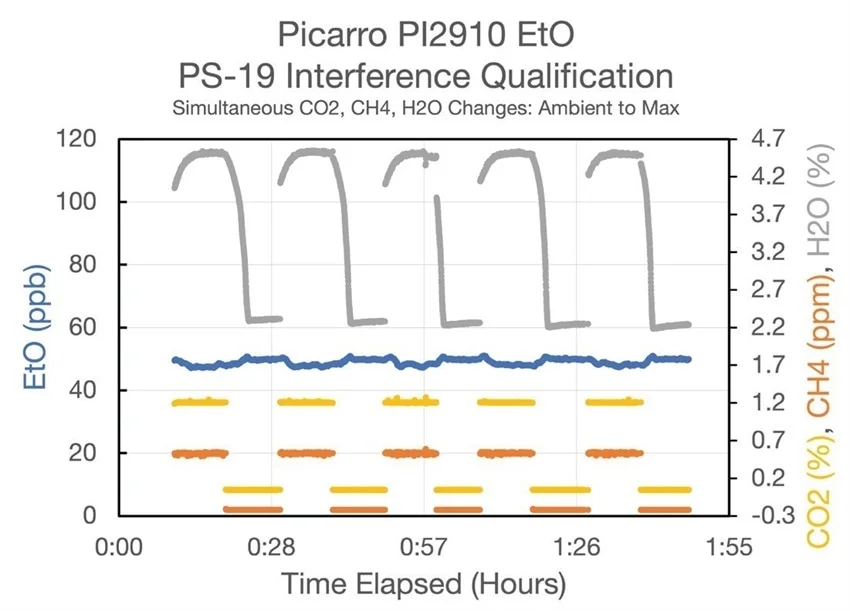
Figure 10. Picarro interference response test showing very minor changes to EtO when all specified interferent gases are simultaneously delivered to the analyzer. Image Credit: Picarro
Level of Detection (PS-19 Section 11.2)
Picarro also performed the Limit of Detection (LOD) test required in PS-19 Section 11.2. This was done by varying the EtO between 0 and 6 ppb (approximately 10 times the estimated LOD according to the draft rule) and repeating the test seven times in an ambient matrix incorporating maximum interferent concentrations (Figure 11).
In this instance, the LOD was defined as 3x the standard deviation of the mean of the seven zero steps. The precise nature of the LOD in PS-19 is ambiguous, but based on the proscribed allowed emissions limit, Picarro’s system confidently satisfies a LOD of 20 ppb, assuming the specified limit is 100 ppb (20% of 100 ppb = 20 ppb).
The tested limit was 0.239 ppb, exceeding the likely requirement more than 80 times over.
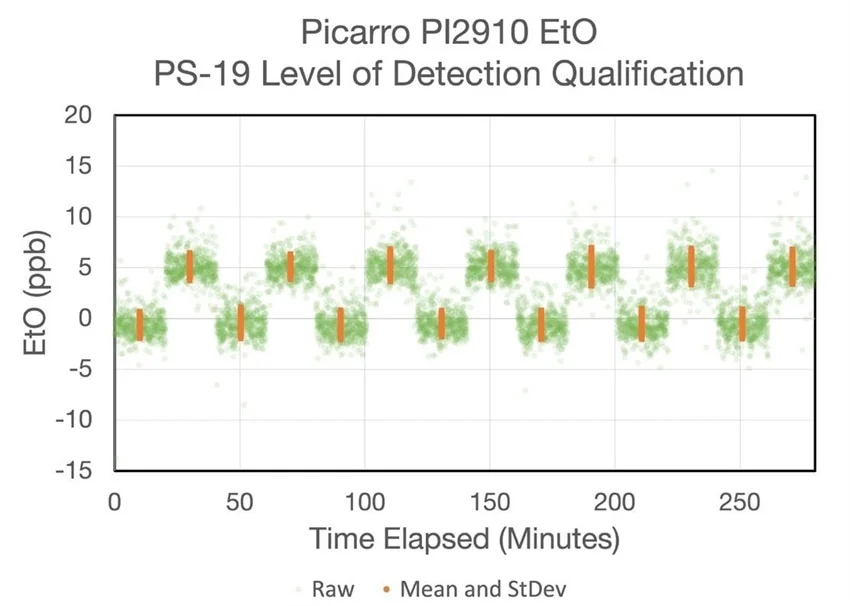
Figure 11. Picarro LOD test showing strongly reproducible and differentiable mean/standard deviation (orange dot with error bar) values for both zero and 10x LOD steps. Image Credit: Picarro
Measurement Error (PS-19 Section 11.4)
The draft rule's specific measurement error test mandates an error of less than 5% of instrument span or 10 ppb when comparing measured versus target gas concentrations.
The Picarro CEMS was found to clear this test, achieving an average error of just 0.154% - comfortably below the 5% threshold specified in PS-19 Section 13.3 (Figure 12).
“The Picarro EtO CEMS system passes all three PS-19 lab qualification tests easily—even when run with the most testing criteria—beating the requirement by a factor of 20 to 80.”
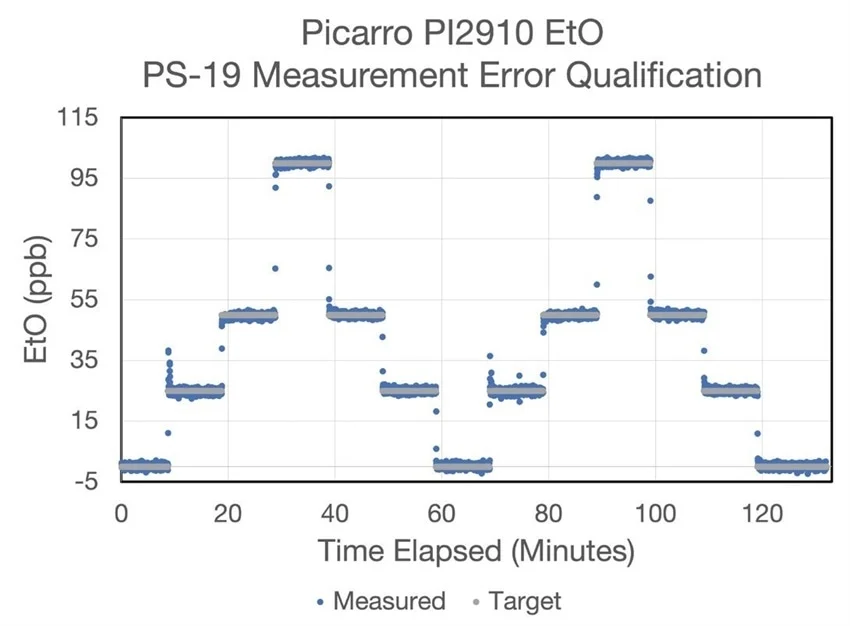
Figure 12. Picarro Measurement Error Test depicting measured (blue) and target (gray) concentrations, revealing the power and linearity of Cavity Ring-Down Spectroscopy. Image Credit: Picarro
Conclusion
Picarro and Carus worked together to evaluate the destruction efficiency of the CARULITE® 500 catalyst material, which is employed in many leading catalytic abatement systems in laboratory settings worldwide.
These assessments utilized EtO concentrations typically found in chemical plant catalytic oxidizers or commercial sterilizers.
The tests confirmed a destruction efficiency of 99.99988% over inlet concentrations ranging from 100 to 1000 ppm—an excellent result and more than “five-nines” destruction efficiency.
Further concentrations of CH4, CO2, and H2O were used to verify the accuracy and integrity of this test. It was determined that a tracer gas (CH4) flowed through the test rig without loss, as anticipated at the specified temperature. As predicted by stoichiometry, EtO was found to be efficiently destroyed, leaving CO2 and H2O at a 1:2 ratio.
The new EtO NESHAP and the Amended Rule 1405 in SCAQMD regulations state that abatement systems must offer 99.94% and 99.99% destruction efficiency, respectively.2,4
The results illustrated here confirm that Carus’s catalyst products offer abatement system manufacturers a robust core around which to develop their abatement systems.
References and Further Reading
- Carus [Online]. Available at: https://www.carusllc.com/ (Accessed on: unknown)
- EtO NESHAP 40 CFR Pt. 63 Subpart O [Online]. Available at: https://www.epa. gov/system/files/documents/2024-03/7055_etosterilizers_final_20240301_admin_disc.pdf (Accessed on: unknown)
- EPA PS-19 [Online]. Available at: https://www.regulations.gov/document/ EPAHQ-OAR-2019-0178-0490 (Accessed on: unknown)
- South Coast Air Quality Management District Amended Rule 1405 [Online]. Available at: https://www.aqmd.gov/docs/default-source/rule-book/reg-xiv/rule-1405.pdf (Accessed on: unknown)
- Picarro. [Online] Carus LLC Selects Picarro as Technology Partner for Ethylene Oxide Emissions Monitoring and Abatement. Available at: https://www. picarro.com/eto/company/press-releases/2023/carus_llc_selects_picarro_as_technology_partner_for_ethylene_oxide (Accessed on: unknown)
- Picarro. [Online] Ethylene Oxide: A Comprehensive Approach to Ethylene Oxide Emissions Management. Available at: https://www.picarro. com/eto (Accessed on: unknown)
- Wikipedia. [Online] OMEGA process. Available at: https://en.wikipedia.org/wiki/OMEGA_process (Accessed on: unknown)
- Continuous process for the production of choline chloride [Patent]. Available at: https://patents.google.com/patent/US3373201A/en
- CDC. [Online] Ethylene Oxide “Gas” Sterilization. Available at: https://www.cdc.gov/infection-control/hcp/disinfection-sterilization/ethylene-oxide-sterilization.html (Accessed on: unknown)
- Gamma Industry Processing Alliance White Paper: file:Users/jbent/Desktop/CleanUp/Comparison_Sterilization_ Technologies_GIPA-WP-GIPA-iia-Sterilization-ModalitiesFINAL-Version-2017-October-308772.pdf
- FIFRA PID: https://www.federalregister.gov/documents/2023/04/13/2023-07727/pesticide-registration-review-proposed-interim-decision-and-draft-risk-assessment-addendum-for
- Alicat Scientific [Online]. Available at: https://www.alicat.com/ (Accessed on: unknown)
Acknowledgments
Produced from materials originally authored by Sean Cronin from Picarro, Inc.

This information has been sourced, reviewed and adapted from materials provided by Picarro.
For more information on this source, please visit Picarro.