Sponsored by HORIBAReviewed by Olivia FrostAug 14 2025
As the requirements for electric vehicles and other portable devices become increasingly rigorous, the need for high-performance batteries and the capability to monitor the physical and chemical properties of battery materials continues to grow. Among the emerging materials, finding more applications in rechargeable lithium-ion batteries are lithium iron phosphates (LFPs), used to comprise the cathode, and carbon-coated silicon (Si@C), utilized in anode development.
LFPs are notable for their enhanced safety, reduced cost, and extended lifetime compared to nickel cobalt-based batteries. However, their inherently low electrical conductivity necessitates carbon coating to enhance conductivity. Carbon-coated silicon is of interest as a potential anode material, as silicon offers ten times the theoretical capacity of conventional graphite anode, while the carbon coating provides structural stability and boosts conductivity.
Particle size is a critical factor to monitor, as it influences almost all performance parameters of battery materials. Generally, smaller and narrow distributions are superior to wider and coarser distributions.
Reduced particle size typically results in greater surface area for electrochemical reactions; however, nanosized materials may exhibit poor packing density and diminished volumetric energy density.
Another concern with nanosized particles is their excessively high surface area, which can lead to substantial lithium loss during the initial charge-discharge cycle due to the significant surface area of the electrode requiring passivation. Conversely, the presence of stray coarse particles can promote lithium plating on the anode surface, reducing capacity and increasing the likelihood of dendrite formation and short circuiting.
Particle shape also influences packing density and, consequently, volumetric energy density. Irregularly shaped particles have greater surface area than spherical particles of equivalent size. Although this increases the area for electrochemical reactions, it also results in increased lithium loss during the initial charge-discharge cycle.
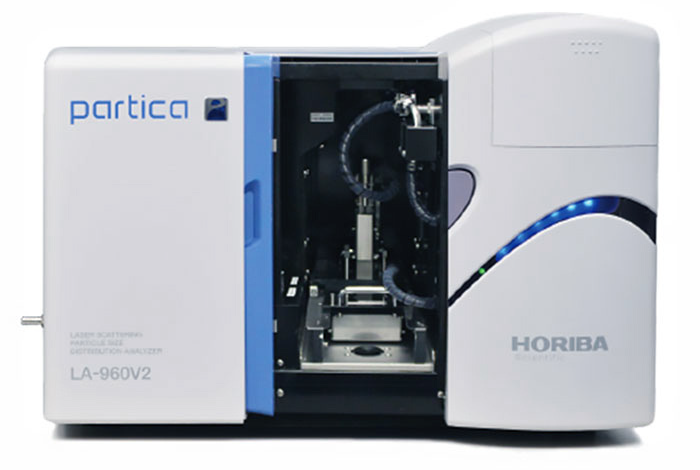
The Partica LA-960V2 Laser Scattering Particle Size Distribution Analyzer with LY-9610 Imaging Unit Accessory. Image Credit: HORIBA
Raman spectroscopy can be used to obtain additional chemical insight into the carbon present in both LFP carbon coatings and carbon-coated silicon particles. The resulting Raman spectra exhibit a G band, the primary mode for graphite, whose width can be utilized to measure the degree of graphitization, or the extent to which the carbon resembles ideal graphite. Raman spectroscopy can also be employed to measure defect levels via the area integrated intensity ratio of the D band to the G band (AD/AG).
The degree of graphitization is a key parameter to monitor for battery performance, as higher graphitization enhances electrical conductivity and lithium-ion intercalation efficiency. Conversely, monitoring graphite defect levels is essential as a moderate defect level enhances capacity rates, while excessive defects can compromise graphite’s structural quality.
Two LFP powder samples—one in an agglomerated state prior to processing (LFP-1) and another in an un-agglomerated state following processing (LFP-2)—as well as one carbon-coated silicon powder sample were supplied for analysis of physical characteristics using particle size and shape analysis. Raman spectroscopy was employed to analyze chemical characteristics to identify possible parameters that may influence battery performance.
Analytical Test Method for Particle Characterization Analysis
Particle size distribution was determined using a HORIBA LA-960V2 employing the laser diffraction strategy. Particle shape information was determined using the HORIBA LY-9610 Imaging Unit accessory, positioned in-line with the flow cell to further measure shape information via dynamic image evaluation.
- Method
- Cell: Flow Cell
- Refractive index: 1.920-0.522i
- Circulation level: 3
- Agitation level: 3
- Dispersion Medium: Isopropyl alcohol (IPA)
Test Procedure:
- Feed the LA-960V2 with IPA.
- Add sample to 90% transmittance.
- (For LFP-2 sample) Sonicate for one minute on level 7.
- Conduct a measurement for size information.
- Conduct a measurement with the image accessory (LY-9610) for shape information.
Analytical Test Method for Raman Spectroscopy
Raman spectra were acquired with a HORIBA XploRA™ PLUS Confocal Raman Microscope.
- Method
- Laser wavelength: 532 nm
- Laser power: < 1 mW on sample
- Raman data sets: 400 points spectra for each sample
Raman spectra were processed by fitting peak models and extracting peak parameters from each spectrum, using QCarbon, a LabSpec6 app developed by HORIBA Raman.
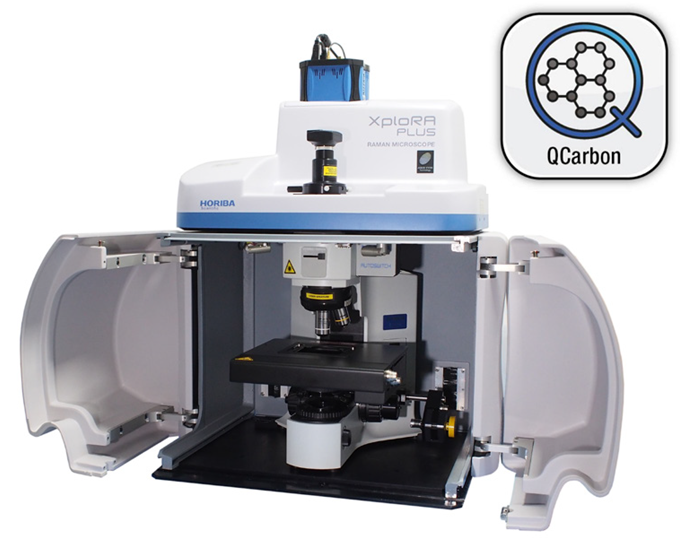
The XploRA PLUS Confocal Raman Microscope. Image Credit: HORIBA
Particle Size & Shape Distribution Results
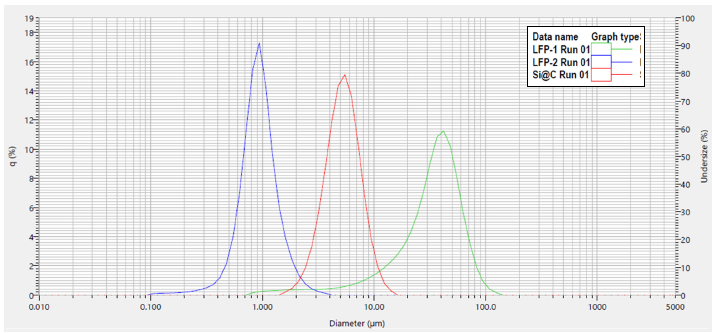
Figure 1. Particle size distribution graph of carbon-coated LFP and carbon-coated silicon materials by laser diffraction (LA-960V2). Image Credit: HORIBA
| Sample |
D10 (μm) |
D50 (μm) |
D90 (μm) |
| LFP-1 |
10.95285 |
35.56009 |
62.72018 |
| LFP-2 |
0.58444 |
0.92162 |
1.47895 |
| Si@C |
3.21320 |
5.25152 |
8.27677 |
Figure 2. Particle size distribution data of carbon-coated LFP and carbon-coated silicon materials by laser diffraction (LA-960V2). Image Credit: HORIBA
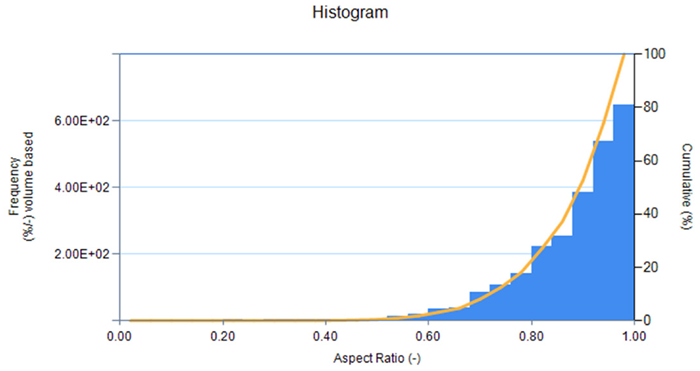
Figure 3. Aspect Ratio distribution graph (width/length) for LFP-1 from imaging unit accessory (LY-9610). Image Credit: HORIBA
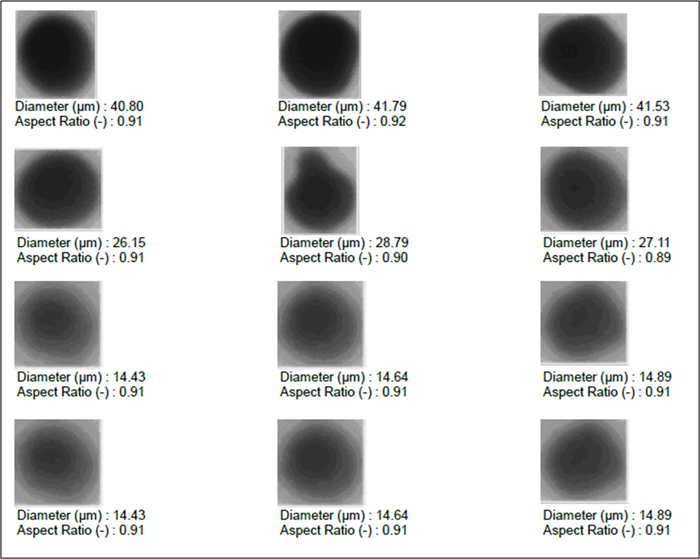
Figure 4. Particle image list for LFP-1 from imaging unit accessory (LY-9610). Image Credit: HORIBA
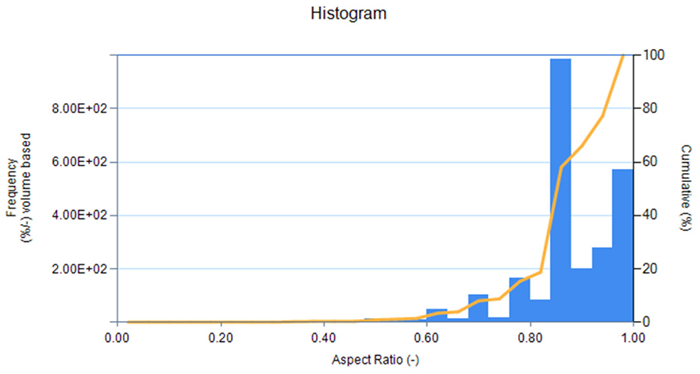
Figure 5. Aspect ratio distribution graph (width/length) for LFP-2 from imaging unit accessory (LY-9610). Image Credit: HORIBA
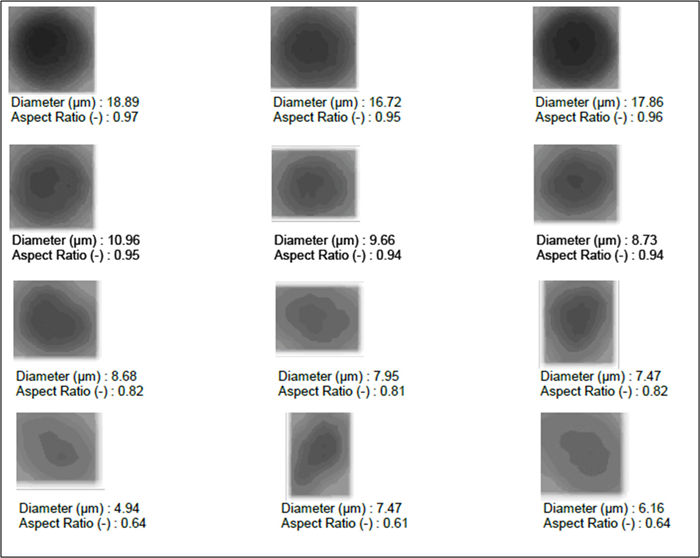
Figure 6. Particle image list for LFP-2 from imaging unit accessory (LY-9610). Image Credit: HORIBA
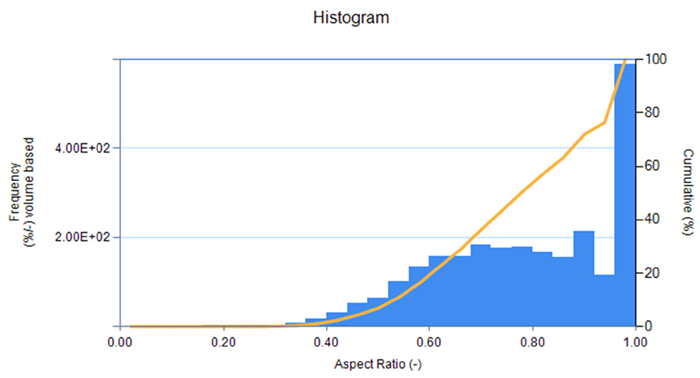
Figure 7. Aspect ratio distribution graph (width/length) for carbon-coated silicon from imaging unit accessory (LY-9610). Image Credit: HORIBA
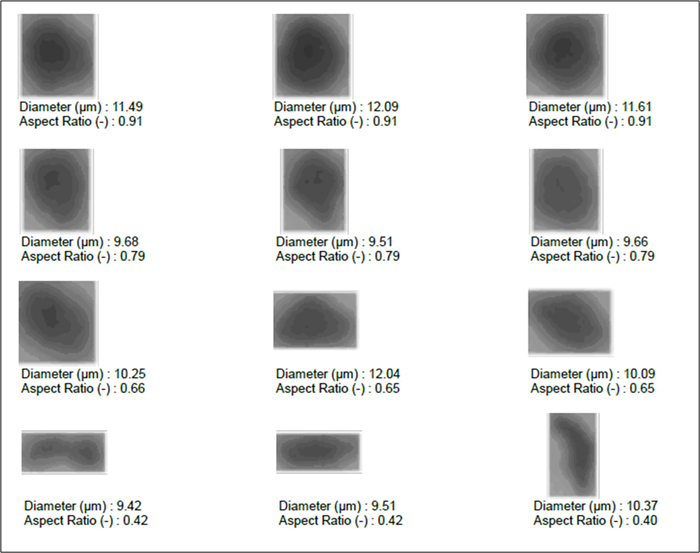
Figure 8. Particle image list for carbon-coated silicon from imaging unit accessory (LY-9610). Image Credit: HORIBA
| Sample |
X10 (μm) |
X50 (μm) |
X90 (μm) |
| LFP-1 |
0.7392 |
0.9157 |
0.9902 |
| LFP-2 |
0.7667 |
0.9431 |
0.9902 |
| Si@C |
0.5314 |
0.7510 |
0.9392 |
Figure 9. Aspect ratio distribution (width/length) from imaging unit accessory (LY-9610) for battery materials. Image Credit: HORIBA
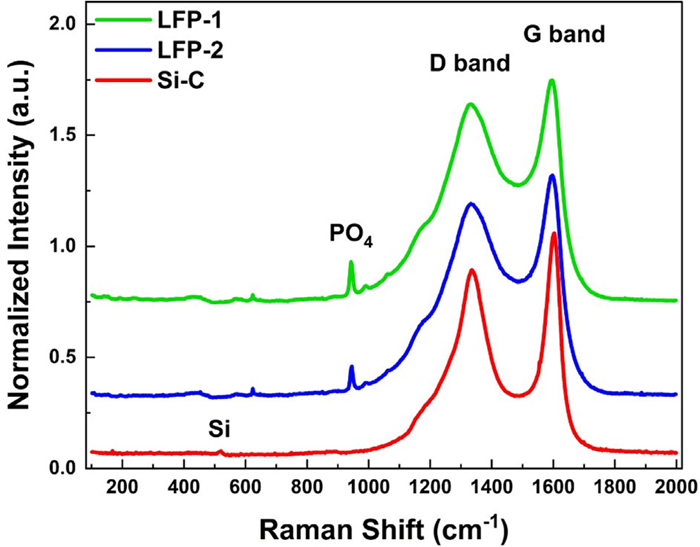
Figure 10. Raman spectra of carbon-coated LFP and carbon-coated silicon materials. Image Credit: HORIBA
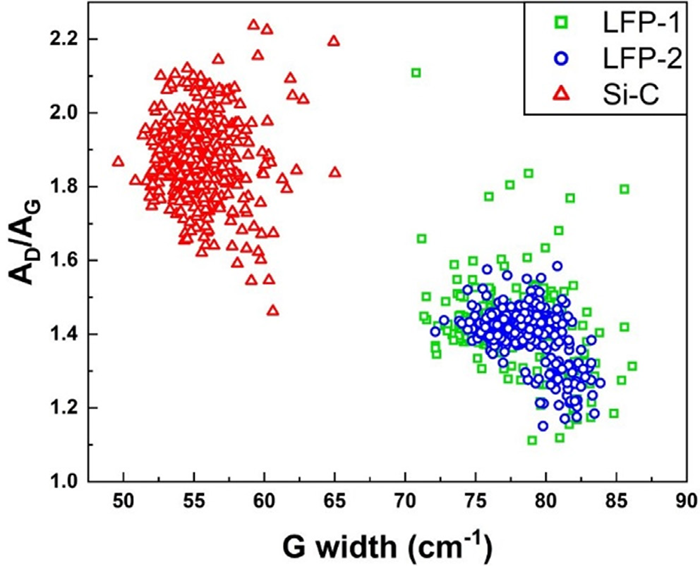
Figure 11. Scatter plot of AD/AG vs G width of carbon-coated LFP and carbon-coated silicon materials (400 points of spectra for each sample). Image Credit: HORIBA
| Sample |
AD/AG Mean |
AD/AG StDev |
| LFP-1 |
1.427 |
0.094 |
| LFP-2 |
1.408 |
0.066 |
| Si@C |
1.875 |
0.110 |
Figure 12. Raman spectroscopy AD/AG mean and standard deviation results for carbon-coated LFP and Si materials. Image Credit: HORIBA
| Sample |
G Width Mean |
G Width St. Dev. |
| LFP-1 |
77 |
2.586 |
| LFP-2 |
78 |
1.980 |
| Si@C |
55 |
2.143 |
Figure 13. Raman spectroscopy G Width mean and standard deviation results for carbon-coated LFP and Si materials. Image Credit: HORIBA
Discussion
LFP-2 exhibits a small and narrow particle size distribution, signifying a large surface area available for electrochemical reactions. LFP-1 includes a tail of fine particles extending to 1 μm, consistent with its status as the agglomerated, unprocessed form of LFP-2, which itself has a median of approximately 1 μm. The carbon-coated silicon also exhibits a small, narrow size distribution, suggesting favorable cell performance.
The shape information indicates that both LFP-1 and LFP-2 possess high aspect ratios, suggesting high sphericity, higher packing density, and increased volumetric energy density. In contrast, carbon-coated silicon exhibits a lower aspect ratio, signifying that the particles are less spherical and generally have reduced packing density as well as lower volumetric energy density. Visually, the particle image lists display more spherical particles for the LFP samples and more angular particles for the carbon-coated silicon sample.
Raman spectroscopy results reveal similar AD/AG ratios and G band widths for the LFP samples, indicating comparable defect levels and degrees of graphitization. These results demonstrate that LFP-1 did not experience significant chemical alterations after being processed into LFP-2.
LFP-1 exhibits a higher standard deviation for both AD/AG and G width results, suggesting that there are likely more agglomerates and greater variation in defects associated with LFP-1. The carbon-coated silicon sample yields significantly different AD/AG and G width results compared to the LFP findings, indicating it experienced a different carbon coating process.
The G width mean is lower for carbon-coated silicon compared to the LFP samples, signifying that the graphite in the carbon coating on the silicon exhibits an increased level of graphitization. All samples display a high D band, indicating a substantial presence of defects or doping within the carbon structure of the coating.
In addition to the graphite D and G bands, a P–O bond of PO43- appears in the LFP spectra around 946 cm-1. The height of this band provides insight into the carbon coating thickness, with the reduced height of the P-O band of LFP-2 suggesting a thicker coating. Likewise, a Si band is observable in the carbon-coated silicon spectrum around 520 cm-1, which can be utilized to compare the carbon coating thicknesses of similar carbon-coated silicon samples.
Conclusion
The findings demonstrate that physical size and shape parameters of battery materials, such as the diameter and aspect ratio, are key indicators of available surface area and volumetric energy density. Furthermore, the chemical parameters of the carbon in the graphite coating can be monitored using the AD/AG ratio and G width, which track defect levels and graphitization degrees, respectively, influencing electrical conductivity, capacity rates, and structural quality.
The HORIBA LA-960V2 laser diffraction particle size analyzer, along with the in-line LY-9610 imaging unit accessory, is effective for measuring the size and shape properties of bulk powder battery material. The HORIBA XploRA PLUS Confocal Raman microscope can be employed to monitor defect levels and graphitization degrees in carbon coatings on battery materials.

This information has been sourced, reviewed and adapted from materials provided by HORIBA.
For more information on this source, please visit HORIBA.