Spectroscopists are often required to identify an unknown compound from a measured spectrum, verifying sample integrity, and defining detected impurities in a sample. Performing a spectral search can address all these challenging applications.
Spectral searching has historically been performed using de-resolved or low-resolution spectra, but the increasing availability of less expensive disk storage space and the advent of faster, more powerful computers have made searching higher-resolution spectral libraries a far more viable and attractive option.
Thermo Scientific offers high-resolution libraries that significantly improve search results.
Standard de-resolved spectral databases contain spectra at 16 cm-1 resolution with data points every 8 cm-1 and 8-bit ordinate precision. Thermo Scientific also offers high-resolution 4 cm-1 spectral libraries with data points every 2 cm-1 and 16-bit ordinate precision.
Searching with the high-resolution 4 cm-1 library delivers enhanced spectral matches, improved spectral subtraction results, and superior overall search results compared to the 16 cm-1 libraries.
Improved Spectral Match
High-resolution libraries offer an improved spectral match between the unknown sample and the library sample spectra because these libraries include more spectral information and are closer to the acquired sample.
For example, a comparison of the number of data points collected for both high- and low-resolution libraries reveals four times more points collected for a 4 cm-1 resolution spectrum, meaning there is four times the information versus the information available in a de-resolved spectrum.
The 4 cm-1 spectra in the high-resolution libraries are also more similar to the sample spectra, which are generally obtained at 4 cm-1 resolutions.
Collecting the sample and library spectrum at the same resolution results in the same number of collected points and identical data spacing, meaning that band shapes and peak heights will more closely resemble one another.
Figure 1 features three different spectra acquired from a polypropylene sample. The top spectrum is a 25 µm film produced using the Spectra-Tech Universal Film Maker™. The bottom two spectra were copied from the high-resolution and de-resolved Hummel Polymer spectral libraries, respectively.
This plot reveals spectral differences over a wide range and a more detailed look at the region from 1600 cm-1 to 600 cm-1. The full range plot highlights the impact of lower resolution on a spectrum, but the loss of spectral information is more pronounced when comparing the two spectra over the narrow region displayed.
The lower resolution spectrum loses a considerable amount of information, with this loss of information enhanced when the spectrum includes subtle spectral features or narrow bands.
Since the lower resolution spectrum collects fewer data points, there is more space between the collected points and more lost information between data points. This loss of data results in the presence of lower intensity peaks that fail to represent the sample accurately.
Figure 1 presents an example of the impact of resolution on a narrow band, specifically in the peak at 1380 cm-1. It can be observed that this peak’s intensity drops from 0.5 absorbance units to 0.35 absorbance units in the de-resolved spectrum.
When spectral features are small, the information in a de-resolved spectrum can be lost entirely. In the example presented, it is possible to clearly distinguish peaks at 1435 cm-1 and 1360 cm-1 located on the shoulder of a stronger absorbing peak in the unknown sample spectrum and the high-resolution library spectrum. However, it is impossible to distinguish this peak in the 16 cm-1, low-resolution library spectrum.
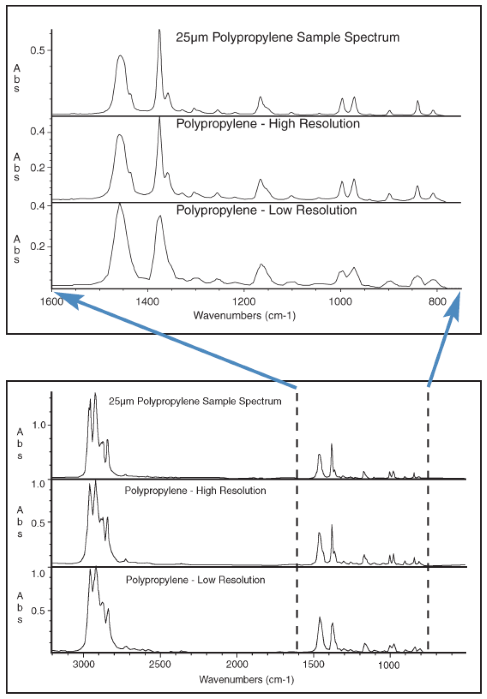
Figure 1. Image Credit: Thermo Fisher Scientific - Vibrational Spectroscopy
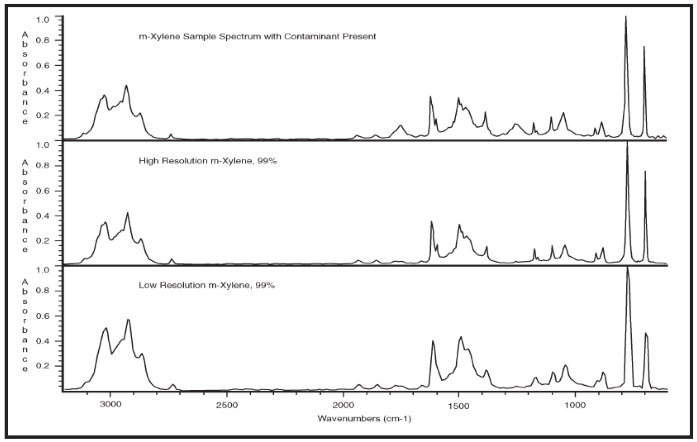
Figure 2. Image Credit: Thermo Fisher Scientific - Vibrational Spectroscopy
Improved Spectral Subtraction Results
Library spectra are also regularly used to determine impurities or additives contained within a sample. The spectrum from a library can be used to perform a spectral subtraction of the known component, potentially revealing the sample’s impurity. Using a high-resolution library spectrum will improve the results of this operation.
The example shown in Figure 2 highlights the benefits of using high-resolution libraries for spectral subtraction. The top spectrum is a 4 cm-1 resolution spectrum acquired from m-xylene with one percent ethyl acetate contaminant.
The second and last spectra are pure m-xylene spectra taken from the high-resolution and de-resolved Aldrich Condensed Phase Supplement Libraries, respectively. Two ‘extra’ peaks can be observed in the sample spectrum at 1740 cm-1 and 1245 cm-1. Determining the identity of the impurity can be performed using a spectral subtraction.
Figure 3 shows the interactive subtraction of the high-resolution spectrum of m-xylene from the sample spectrum. Figure 4 presents a search of the subtraction result with the high-resolution Aldrich Condensed Phase library, showing the contaminant as ethyl acetate.
When a subtraction is performed with a low-resolution library, the sample spectrum must be de-resolved to match the resolution of the library spectrum. De-resolving the sample spectrum leads to a loss of spectral information, producing spectral artifacts in the subtraction result, including negatively absorbing peaks.
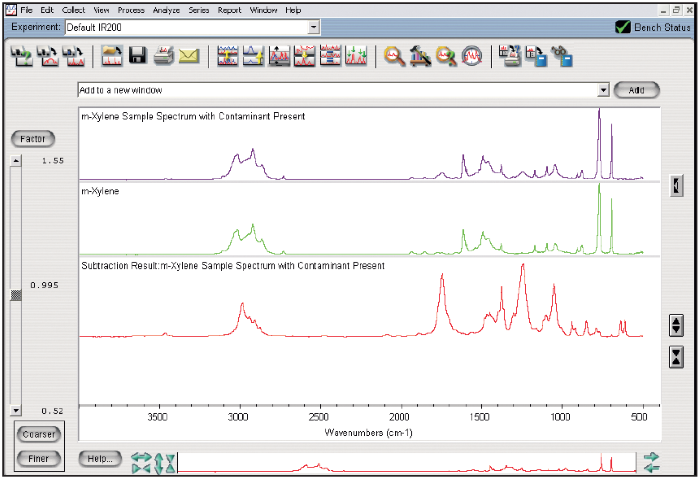
Figure 3. Image Credit: Thermo Fisher Scientific - Vibrational Spectroscopy
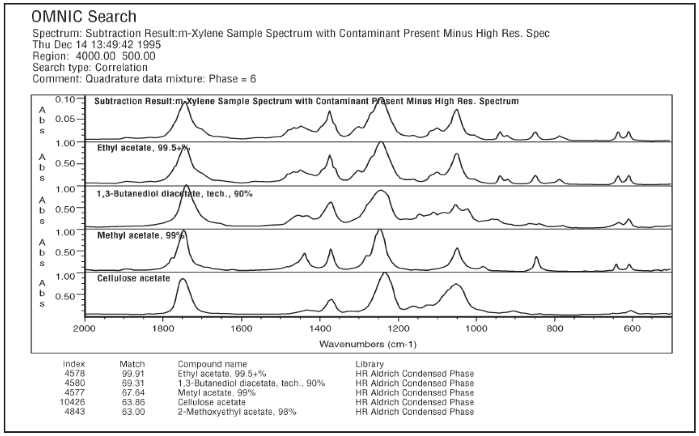
Figure 4. Image Credit: Thermo Fisher Scientific - Vibrational Spectroscopy
Improved Search Results
High-resolution libraries improve search results and enhance the spectral match between the sample and library spectrum.
Higher-resolution libraries include spectra that are more similar to the spectra collected in the lab. Searching with high-resolution libraries may not increase the match number obtained, but there will be an increased difference between the first and second matches in the search list.
The match number measures how closely a sample spectrum matches a spectrum from the selected library. A match number of 100 would indicate a perfect match, but this number alone does not confirm an acceptable spectral match.
A better measure of the search results can be collected by comparing the match numbers from the first, second, and potentially third spectrums selected as the best match for the sample spectrum.
A small difference between match numbers indicates that the sample could be any one of the selected compounds, with search results proving less definitive. The use of high-resolution libraries increases the difference between the match numbers of the selected compounds.
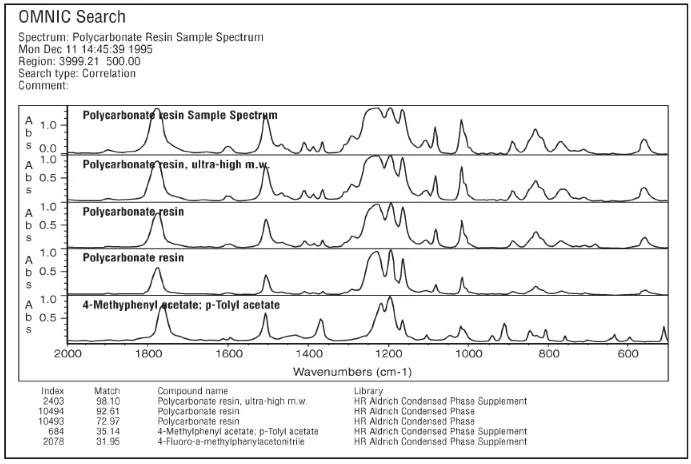
Figure 5a. Image Credit: Thermo Fisher Scientific - Vibrational Spectroscopy
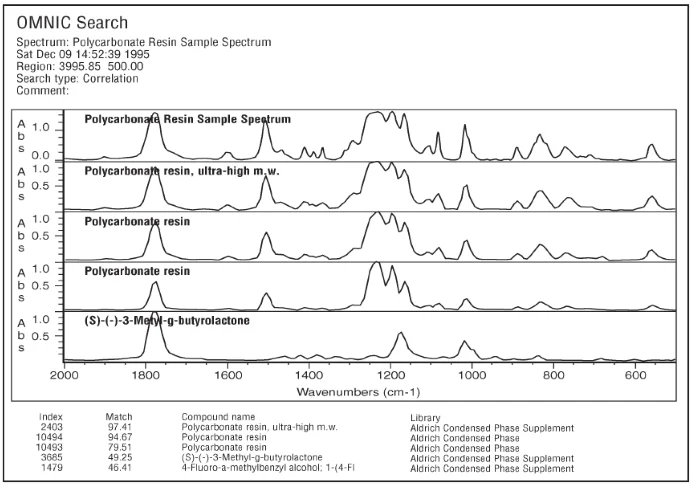
Figure 5b. Image Credit: Thermo Fisher Scientific - Vibrational Spectroscopy
A further example is the spectrum of a 15 µm film of polycarbonate resin acquired at 4 cm-1 resolution via transmission. This was then searched using the high- and low-resolution versions of the Aldrich Condensed Phase and Aldrich Condensed Phase Supplement Libraries. Figure 5a and Figure 5b show the results of these searches.
The match number using the high-resolution library is marginally higher for this sample, but the most notable benefit of using high-resolution libraries is the difference between the first, second, and third match numbers. Here, the high-resolution results have six units between the first two matches, while the low-resolution results have fewer than three units of difference.
Conclusions
Employing high-resolution libraries when spectrally searching the sample spectrum has several advantages. High-resolution libraries include spectra with more spectral information, produce improved results from spectral subtraction, and deliver enhanced search results.
Using a 4 cm-1 high-resolution library improves the results, whether libraries identify an unknown sample, verify the sample integrity, or determine what impurities are present in an otherwise known sample.
Acknowledgments
Produced from materials originally authored by Thermo Scientific.

This information has been sourced, reviewed and adapted from materials provided by Thermo Fisher Scientific - Vibrational Spectroscopy.
For more information on this source, please visit Thermo Fisher Scientific - Vibrational Spectroscopy.