Fourier transform infrared (FTIR) spectroscopy is the preferred method of infrared spectroscopy. In this approach, IR radiation passes through a sample, where some of it is absorbed by the sample while some is transmitted.
The resulting frequencies are translated into a spectrum that represents this molecular absorption and transmission, forming a molecular fingerprint of the sample. And, like a fingerprint, no two unique molecular structures generate the same infrared spectrum, making infrared spectroscopy advantageous for a multitude of analyses.
What Information Can FTIR Provide?
- Identification of unknown materials
- Determination of sample quality and consistency
- Determination of the number of components in a mixture.
This article introduces the concepts behind FTIR spectroscopy, covering the basic theory of FTIR, how it works, and detailing practical aspects of its use. The aim is to provide a clear understanding of the value and utility of this powerful method.
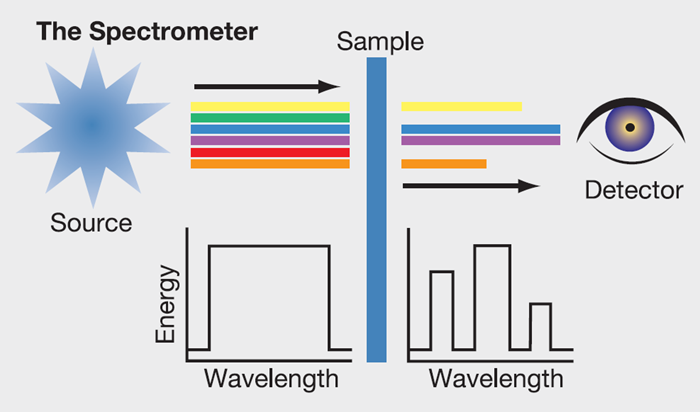
Image Credit: Thermo Fisher Scientific - Vibrational Spectroscopy
Theory of FTIR
Why Infrared Spectroscopy?
For over seventy years, infrared spectroscopy has been a workhorse technique for materials analysis in laboratories. An infrared spectrum represents a sample's fingerprint, with absorption peaks corresponding to the vibration frequencies between the atomic bonds that make up the material. No two compounds generate identical infrared spectra, as each material possesses a unique combination of atoms.
As such, infrared spectroscopy enables the positive identification of different kinds of material through qualitative analysis. In addition, the size of the peaks in a spectrum provides a direct indication of the amount of material present. Infrared, combined with contemporary software algorithms, is an outstanding instrument for quantitative analysis.
Earlier Technology
The first infrared tools were dispersive instruments that separated individual energy frequencies emitted from the infrared source using a prism or grating. An infrared prism functions in the same way as a visible prism, which separates visible light into its colors (frequencies).
A grating is an updated modern dispersive component that efficiently separates infrared energy frequencies. The detector measures the amount of energy at each frequency that has passed through the sample, resulting in a spectrum that plots intensity versus frequency.
FTIR spectroscopy is preferred over dispersive or filter techniques of infrared spectral analysis as it is:
- Non-destructive
- Provides an accurate measurement technique without requiring external calibration
- Collects a scan per second
- Enhances sensitivity, allowing one-second scans to be co-added together to ratio out random noise
- Offers improved optical throughput
- A mechanically simple technique using just one moving component.
Why FTIR?
FTIR spectrometry was developed to address the limitations of dispersive tools at the time, the most well-known being the slow scanning process. A new technique was needed to measure all infrared frequencies concurrently rather than individually. The solution was developed using a straightforward optical device known as an interferometer.
The interferometer generates a unique signal that contains all the infrared frequencies ‘encoded’ into it. This signal can be measured quickly, typically within one second. As a result, each sample measurement requires only a few seconds - instead of several minutes.
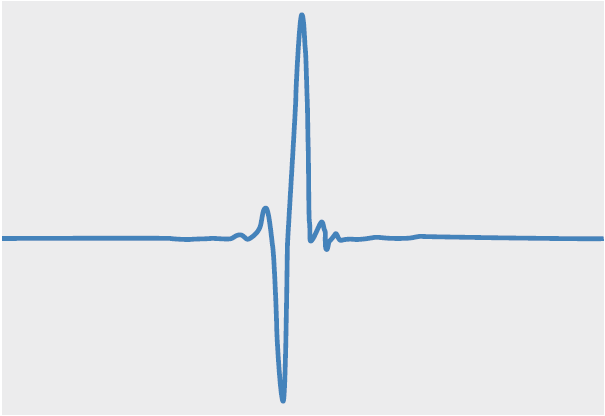
Image Credit: Thermo Fisher Scientific - Vibrational Spectroscopy
Most interferometers use a beamsplitter that divides the incoming infrared beam into two optical beams. One beam reflects off a stationary flat mirror. In contrast, the other reflects off a flat mirror mounted on a mechanism that allows it to move away from the beamsplitter a short distance, usually a few millimeters.
The two beams reflect off their respective mirrors and recombine when they meet back at the beamsplitter, where one has traveled a fixed-length path and the other a path that continuously changes as its mirror moves. The signal that exits the interferometer, called an interferogram, results from these two beams ‘interfering’ with each other.
Each data point (a function of the moving mirror position) in the interferogram contains information about every infrared frequency coming from the source. This means that as the interferogram is measured, all frequencies are measured concurrently, enabling extremely rapid measurements.
However, the measured interferogram signal cannot be interpreted directly, as the analyst requires a frequency spectrum (a plot of the intensity at each individual frequency) to identify it.
This requires the ‘decoding’ of the individual frequencies, which is achieved using a well-established mathematical method known as the Fourier transformation. The computer performs this transformation, presenting users with the desired spectral information for analysis.
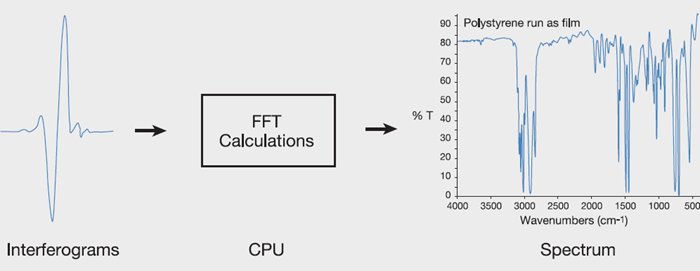
Image Credit: Thermo Fisher Scientific - Vibrational Spectroscopy
The Sample Analysis Process
The typical instrumental process is as follows:
- The source: A glowing black-body source emits infrared energy. This beam passes through an aperture that controls the amount of energy presented to the sample and, ultimately, to the detector.
- The interferometer: The beam enters the interferometer, where ‘spectral encoding’ occurs. The resulting interferogram signal then exits the interferometer, which uses a reference laser for accurate wavelength calibration, mirror position control, and data acquisition timing.
- The sample: After entering the sample compartment, the beam is transmitted through, or reflected off, the sample’s surface, depending on the type of analysis conducted. This is where specific energy frequencies, which are uniquely characteristic of the sample, are absorbed.
- The detector: The beam passes to the detector for final measurement. The detectors used are specifically designed to measure the special interferogram signal.
- The computer: After digitization, the measured signal is sent to the computer, where the Fourier transformation occurs. The final infrared spectrum is presented to the user for interpretation and any further manipulation.
A background spectrum must also be taken since the absorption intensity requires a relative scale. Typically, this measurement is taken without a sample. The result is a 'blank' that can be compared to the measurement with the sample to determine ‘percent transmittance’.
This produces a spectrum with all instrumental characteristics removed, meaning all spectral features are specific to the sample. Since this spectrum is characteristic of the instrument itself, a single background measurement can be used for multiple sample measurements.
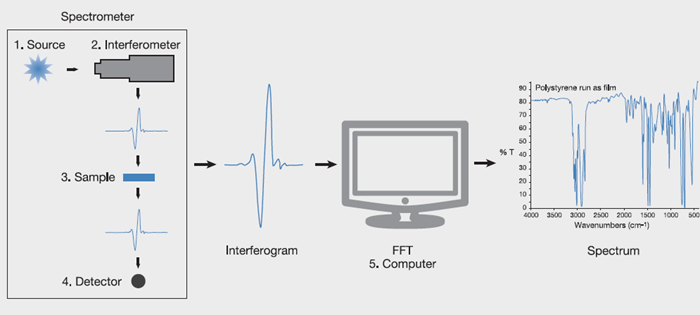
Image Credit: Thermo Fisher Scientific - Vibrational Spectroscopy
A Simple Spectrometer Layout
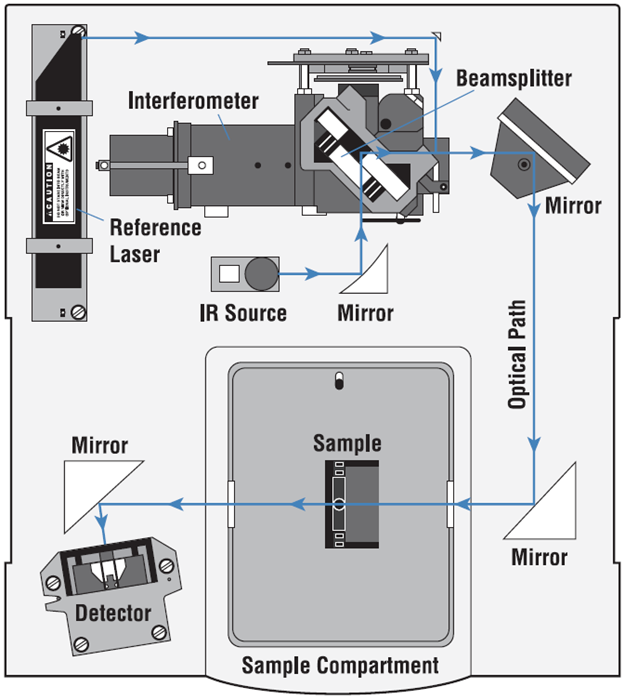
Image Credit: Thermo Fisher Scientific - Vibrational Spectroscopy
Advantages of FTIR
Some key advantages of FTIR over the dispersive technique include:
- Speed: The concurrent measurement of frequencies means most FTIR measurements are conducted in seconds instead of several minutes.
- Sensitivity: In FTIR, sensitivity is greatly enhanced for multiple reasons. The employed detectors have improved detector sensitivity, higher optical throughput (known as the Jacquinot Advantage), which significantly reduces noise levels, and rapid scanning that allows multiple scans to be co-added to reduce random noise to any desired level (known as signal averaging).
- Mechanical simplicity: The interferometer's moving mirror is the only continuously moving part, reducing the likelihood of mechanical failure.
- Internal calibration: These self-calibrating tools use a HeNe reference laser as an internal wavelength calibration standard (known as the Connes Advantage), eliminating the need for user calibration.
These and other advantages make FTIR measurements exceptionally precise and reproducible. As a result, it is a dependable method for positively identifying nearly any sample.
The enhanced sensitivity enables the detection of even the smallest of contaminants. FTIR is, therefore, indispensable for quality control and assurance, including batch-to-batch comparisons to quality standards and analysis of an unknown contaminant.
In addition, the sensitivity and accuracy of FTIR detectors, along with a broad range of software algorithms, have greatly enhanced the practical use of infrared for quantitative analysis. Quantitative methods can be easily developed, calibrated, and incorporated into simple procedures for routine evaluation.
The FTIR technique has provided substantial practical benefits to infrared spectroscopy. This technique has enabled the development of multiple new sampling methods that overcome the limitations of earlier technologies, making the applications of infrared analysis virtually limitless.
Image Credit: Thermo Fisher Scientific - Vibrational Spectroscopy

This information has been sourced, reviewed, and adapted from materials provided by Thermo Fisher Scientific - Vibrational Spectroscopy.
For more information on this source, please visit Thermo Fisher Scientific - Vibrational Spectroscopy.