Meat analogue products derived from plant protein sources have been widely regarded as valuable alternatives to conventional meat. The growing interest in meat alternatives stems primarily from public awareness of a healthier diet and the desire for environmental sustainability (reduced greenhouse gas emissions and better natural resource conservation).
However, replicating the sensory texture and mouthfeel characteristics of real meat remains a major challenge in this area. Therefore, appropriate instrumental techniques are essential for gaining a deeper understanding and more accurate characterization of plant-based meat matrices, allowing for better correlation with sensory analysis.
Time Domain NMR (TD-NMR)
Time-domain NMR (TD-NMR) is a flexible method for determining food sample composition and, more broadly, for performing quality control across various industries. It has also been successfully used for decades to study water and fat distribution in animal meat products, and, more recently, in plant-based meat (PBM). 1,2 Moreover, TD-NMR is non-destructive, benefiting from exceptional repeatability, high precision, and dependability.
Relaxometry Analysis in Food Science
Most TD-NMR studies on food samples are based on relaxometry methods, which are commonly used to analyze water and fat composition and distribution. The transverse relaxation time (T2) is the principal relaxation parameter employed in food analysis. It is typically determined using the Carr-Purcell-Meiboom-Gill (CPMG) sequence, which employs a 90 ° pulse followed by a train of 180 ° pulses to generate a train of echoes.
Image Credit: Antonina Vlasova /Shutterstock.com
The intensities of these echoes decay over time, representing the T2 decay. The other relaxation parameter, the longitudinal relaxation timer (T1), is often measured using the Inversion Recovery (IR) sequence and, when combined with CPMG in the two-dimensional methods (IR-CPMG), provides the T1-T2 correlation.
In food samples, T2 decay is typically described by multi-exponential components related to fat and water proton content. The T2 value can range from microseconds to seconds depending on factors such as the fat type, water content, and the environment confining the water protons. In a typical food sample, water protons correspond to multiple T2 components, representing different “classes” of proton-bearing water populations, which exhibit significantly faster T2 relaxation than free water.3
The longest T2 relaxation time is assigned to a fraction with the greatest degree of proton mobility, whereas the shortest time reflects water protons strongly bound to other ingredients or confined within the food matrix.
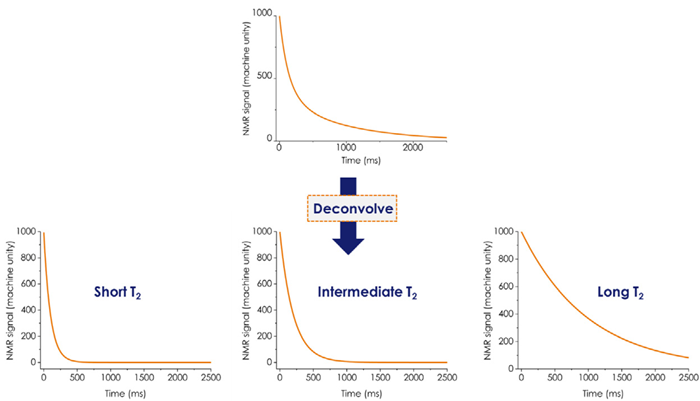
Scheme 1. Multiexponential transverse relaxation (T2) decay. Image Credit: Oxford Instruments
Relaxometry Analysis of Meat/Meat Analogues
TD-NMR has been employed extensively in the food processing industry to study water-protein interactions, providing insights into multiple macroscopic characteristics. This includes water-holding capacity (WHC), which describes the ability of proteins to retain water inside the pores, as well as variations in fat and water content and textural properties during the cooking and storage stages.3
- Studies have shown that T2 values of water protons decrease as a function of protein concentration, signifying reduced freedom and stronger interactions with other ingredients.
- A correlation has been found between the T2 relaxation decay and WHC of various meat types, affecting the textural attributes such as juiciness and tenderness, as well as overall product quality. 3
- T2 has been utilized to study cooking process effects, demonstrating that elevated cooking temperatures promote the migration of bound water within fibrous structures, as reflected by longer T2 relaxation decay. 4
- Two-dimensional TD-NMR experiments have also proven valuable in food studies 5. For instance, they enable better distinction between fat and water signals in food matrices.
1H T2 Distribution from 15 to 75 °C
This study examined the distribution of water and fat in two soy-based burgers under heating conditions ranging from 15 to 75 °C, using MQC-R and a 1H 18 mm liquid variable temperature probe. The nutritional information per 100 g for each burger is summarized in Table 1. The raw CPMG (T2) decays were obtained on both samples and subsequently processed using a one-dimensional inverse Laplace transformation (ILT).
Figure 1 depicts T2 distribution time (1D-ILT) for samples A and B as the temperature increased from 15 °C to 75 °C. For sample A, containing 19 % fat content, both the number of components and the relative area increased with rising temperature.
Furthermore, the T2 relaxation time progressively shifted toward longer values at elevated temperatures. These variations may correspond to structural transformation during heating, as they are primarily driven by physico-chemical events, such as fat crystal melting (and possible separation from water), shrinkage, and expulsion of fluids.
Table 1. Nutrition information per 100 g. Source: Oxford Instruments
| Samples |
PBM burger A |
PBM burger B |
| Fat (g) |
19 (rapeseed and coconut oil) |
6 (rapeseed, sunflower, and coconut oil) |
| Protein (g) |
17 (pea and rice) |
18 (pea and wheat) |
| Salt (g) |
0.7 |
1.1 |
| Carbohydrate (g) |
3.5 |
8.4 |
Sample B, which contained less fat (6 %), exhibited a distinct T2 distribution profile compared to Sample A, suggesting differences in structure and water/lipid partitioning behaviors under similar heating conditions. Generally, T22 and T23 in sample B were shorter than those in sample A (Figure 2), indicating a more compact structure and reduced water mobility in the protein matrix of burger B. The results of the two-dimensional experiment in the following section support this statement.
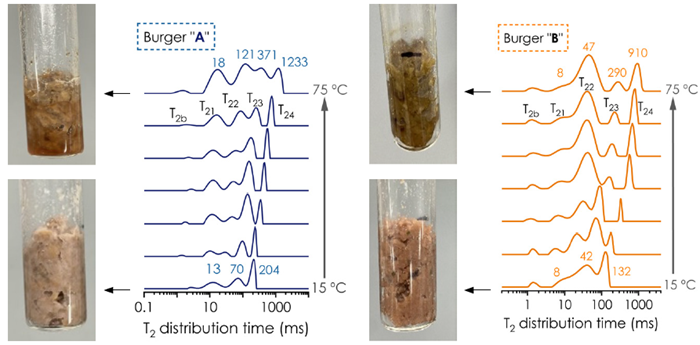
Figure 1. T2 distribution in PBM burgers A (left) and B (right) from 15 to 75 °C. Image Credit: Oxford Instruments
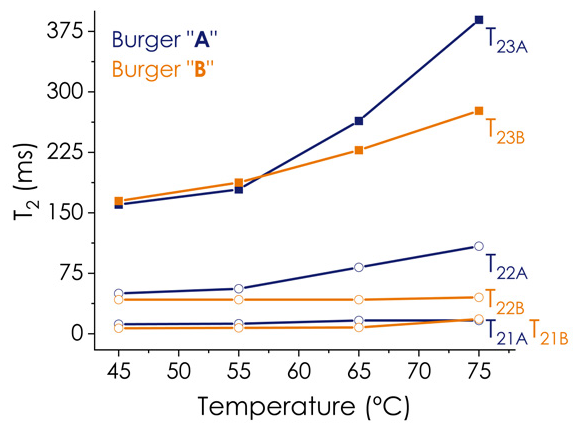
Figure 2. T2 values over the heating process for both PBM burgers A (blue) and B (orange). Image Credit: Oxford Instruments
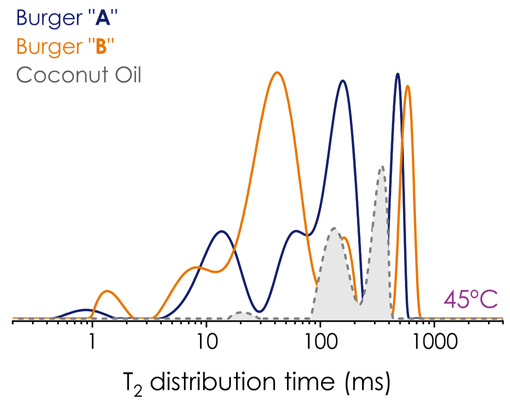
Figure 3. T2 distribution in PBM burgers A (blue) and B (orange) and coconut oil (grey) at 45 °C. Image Credit: Oxford Instruments
To better visualize which component was influenced by lipid content, the CPMG (T2 ) decay of coconut oil was acquired at 45 °C. As demonstrated in Figure 3, components T23 and T24 are more likely to represent both water and the lipid’s protons, as reinforced in the 2D maps. However, T21 and T22 are more closely associated with water protons.
According to the literature, T2b has also been assigned to the protein-bound protons.1,2 Prior studies have also reported four components 2 for a blend of various plant proteins and five components for plant-based analogues.1
T1-T2 maps from 15 to 75 °C IR-CPMG experiments were conducted and processed using the NMR ProLab software by Green Imaging, a straightforward approach for obtaining the T1-T2 maps through the two-dimensional ILT processing method. T1-T2 maps agree with the 1D-T2 distribution but provide additional detail.
Two-dimensional maps (Figure 4) revealed that the T22 component for the PBM A is a combination of two T2 components, whereas in the PBM B, the T22 seemed to overlap three components. This demonstrates that T1-T2 maps are advantageous for analyzing more complex systems with multiple overlapping components. The diagonal line is associated with a T1/T2 ratio equal to 1. The T1/T2 ratio increases as the signals go to the left of this line. The elevated T1/T2 for PBM B at 75 °C suggests that water proton mobility is more constrained in PBM B. This indicates that water has weaker mobility in PBM B, i.e., it has a more rigid structure, consistent with the T2 distribution data.
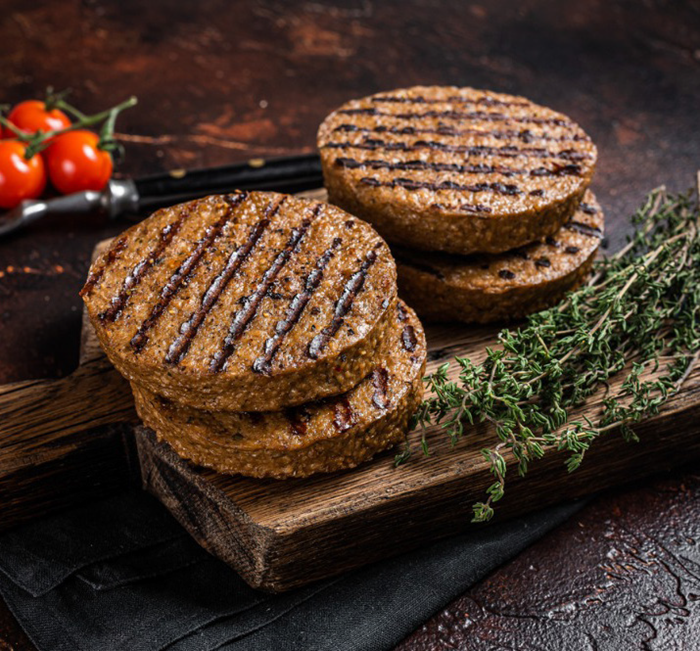
Image Credit: Mironov Vladimir /Shutterstock.com
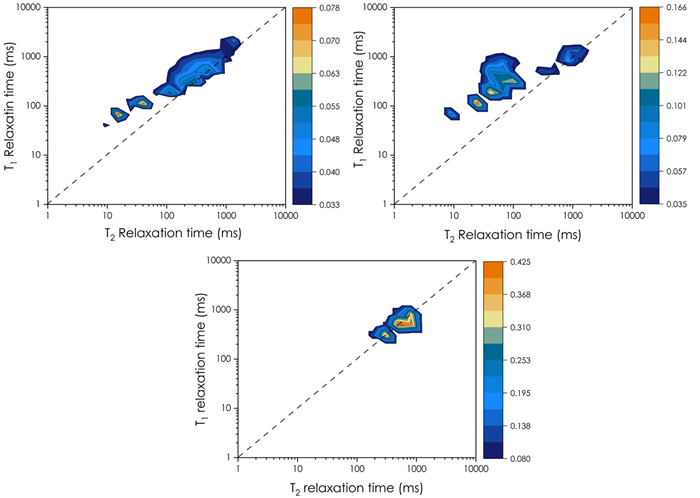
Figure 4. T1-T2 maps at 75 °C for PBM A (on the top left), B (on the top right), and coconut oil (on the bottom). Image Credit: Oxford Instruments
Summary
- This study showcases the capability of TD-NMR to investigate structural changes during simulated cooking of plant-based meat analogue burgers, with the potential to enhance the sensory experience of plant-based products.
- Two-dimensional correlation maps have proven to be a robust additional approach, especially in research and development applications. MQC-R offers NMR ProLab software from Green Imaging that simplifies data acquisition and processing from multiple 1- and 2-D TD-NMR experiments.
- Time Domain NMR is a simple, non-destructive, and non-invasive technique capable of providing valuable insights into the structure of meat and plant-based meat analogues.
- The accessibility and reproducibility of NMR make it an outstanding analytical technology tool for product development and for enhancing customer satisfaction by mimicking the taste and texture of meat.
- TD-NMR analysis requires minimal sample preparation and involves no hazardous chemicals.
Image Credit: Oxford Instruments
References and further reading:
- Nasrollahzadeh, F., et al. (2024). Texture profiling of muscle meat benchmarks and plant-based analogues: An instrumental and sensory design approach with focus on correlations. Food Hydrocolloids, pp.109829–109829. DOI:10.1016/j.foodhyd.2024.109829. https://www.sciencedirect.com/science/article/pii/S0268005X24001036?via%3Dihub.
- Schreuders, F. K. G., et al. (2020). Water redistribution determined by time domain NMR explains rheological properties of dense fibrous protein blends at high temperature. Food Hydrocolloids, 101, p.105562. DOI:10.1016/j.foodhyd.2019.105562. https://www.sciencedirect.com/science/article/pii/S0268005X19323604?via%3Dihub.
- Bertram, H.C., et al. (2002). Continuous distribution analysis of T2 relaxation in meat - an approach in the determination of water-holding capacity. Meat Science, 60(3), pp.279–285. DOI:doi.org/10.1016/s0309-1740(01)00134-6. https://www.sciencedirect.com/science/article/abs/pii/S0309174001001346?via%3Dihub.
- Wang, F., et al. (2023). High-moisture extrusion cooking on soybean-wheat protein mixtures: Effect of sodium alginate/xanthan gum/maltodextrin on promoting a fibrous structure. Frontiers in Nutrition, 9. DOI:/10.3389/fnut.2022.1077601. https://www.frontiersin.org/journals/nutrition/articles/10.3389/fnut.2022.1077601/full.
- Peters, J.P.C.M., et al. (2017). Water-binding capacity of protein-rich particles and their pellets. Food Hydrocolloids, 65, pp.144–156. DOI:10.1016/j.foodhyd.2016.11.015. https://www.sciencedirect.com/science/article/abs/pii/S0268005X16307949.

This information has been sourced, reviewed and adapted from materials provided by Oxford Instruments.
For more information on this source, please visit Oxford Instruments.