While tires are widely regarded as low-tech commodities, they are actually highly engineered structural composites. Tires contain up to 20 different rubber compounds featuring several types of microstructures designed to provide various degrees of grip and traction. Fillers are also added to the main polymer matrix to facilitate rubber reinforcement.
Tire failures typically occur as a result of lower or reduced material quality. The optimal and homogenous dispersion of all the different fillers present in the tire is a key factor in ensuring a higher material quality.
Analytical techniques such as SEM-EDS are needed to gain an in-depth understanding of a failure’s root cause, but the material contrast acquired via a backscattered electron image is not always enough to distinguish between the large range of different materials employed.
This article demonstrates the live quantitative elemental analysis of Axia ChemiSEM, offering an efficient and straightforward means of characterizing the different fillers present in a tire, despite their similar compositional contrast.
Tires are designed to maintain consistent performance and safety properties under a wide range of conditions, all while performing for thousands of kilometers.
Tire aging and tread (the part of the tire in contact with the road) detachment are listed among the most common tire failures, which must be addressed via failure analysis.
Potential causes for these failures are typically directly or indirectly linked to manufacturing or material defects. Rubber mixtures tend to naturally harden over time, meaning that aging leads to reduced elasticity of the rubber parts even if tires are not in use.
The primary raw materials used to manufacture a tire are natural and synthetic rubbers. Rubber products are modified through the addition of reinforcing fillers to each of the different rubber compounds in order to develop proper characteristics of strength, resilience, and wear resistance.
Fillers’ original purpose was the reduction of final product cost, but contemporary rubber manufacturing technology has seen increasing research into the use of selective fillers’ ability to improve specific composite characteristics, depending on their chemical composition.1
For example, specific fillers can enhance product durability, cost, and processability during the manufacturing process.
Reinforcing fillers tend to represent over 40% of the whole tire compound. These fillers play a key role in elastic efficiency and tire aging, leading to potential failure.
Performance is controlled by filler dispersion in the rubber matrix. Enhanced filler dispersion leads to an improved polymer-filler interaction, improving the material’s elastic behavior and the tire’s rolling resistance.
Methods
Scanning electron microscopy (SEM) with backscattered electron imaging (BSE) and energy dispersive X-ray spectroscopy (EDS) are the solutions of choice for characterizing various additives and evaluating their dispersion within the polymer matrix.
BSE images are widely regarded as the easiest solution for the acquisition of compositional information because the contrast seen with BSE images is a result of atomic number variation. This approach helps to differentiate the rubber matrix (low atomic number) from inorganic particles (high atomic number) that are typically employed as fillers.
The wide range of materials used in the tire industry makes EDS analysis valuable for distinguishing between different elements. However, conventional EDS characterization can be time-consuming and requires careful setup of acquisition parameters, which typically demands a certain level of expertise.
This article outlines the characterization of various fillers in a tire cross section obtained via the Axia ChemiSEM, a platform designed to offer the most efficient SEM-EDS user experience possible.
Axia ChemiSEM’s main feature is its capacity for live quantitative elemental mapping, allowing it to overcome the limitations of conventional EDS discussed thus far.
Analysis
Conventional failure analysis workflows rely on the use of microscopic analysis in discovering a failure’s root cause. Low magnification analysis is used initially in order to characterize the specimen and identify potential regions of interest.
This involves acquiring a large field-of-view SEM image via Axia ChemiSEM’s navigation montage of the prepared cross section. Navigation montage is a built-in function of the SEM, enabling straightforward navigation on large samples. This feature also allows the automatic collection of multiple neighboring images, generating a large-scale overview of the sample in a short time.1
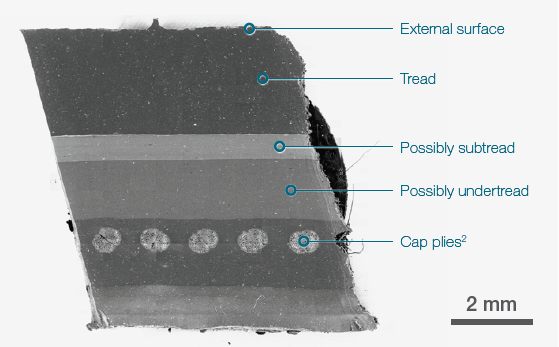
Figure 1. 19x19 tiles montage. Tot acquisition time ≈ 15 mins. Acc voltage 20 keV, beam current 0.94 nA, Low vacuum (30 Pa). Image Credit: Thermo Fisher Scientific – Electron Microscopy Solutions
Higher levels of magnification are necessary in order to evaluate microfeatures such as the dispersion of the various fillers and their distribution over different layers.
In rubber technology, conventional fillers are zinc oxide and carbon black, with carbon black likely the oldest and most widely utilized reinforcing filler. Carbon black application is no longer the preferred solution, however, due to the environmental problems associated with this material. Carbon black is also prone to agglomeration within the rubber matrix.
Zinc oxide is the second most abundant material in the tread rubber matrix. Zinc oxide offers many benefits when employed as an additive in rubber compounds, particularly when used alongside sulfur. Used together, these two ingredients promote the vulcanization process, which shortens the tire curing time and impacts the length and number of crosslinks in the rubber matrix. Zinc oxide’s good conductivity also enhances the removal of heat generated during tire motion.
Figure 2 shows an initial characterization of the fillers and additives. This was done by screening some of them in the upper layer of the tire. Additional analyses of some of the visible objects were also done.

Figure 2. Upper surface (tread). Acc voltage 20 keV, beam current 0.48 nA. Image Credit: Thermo Fisher Scientific – Electron Microscopy Solutions
Figure 3 shows a cluster of zinc oxide particles. Axia ChemiSEM’s user interface has been designed to enable the simultaneous acquisition of different signals in order to increase the amount of information captured.
The left image is a secondary electron image that provides topographical information, confirming that the particles are embedded. The right image is a backscattered electron image that confirms that the embedded particles have a higher atomic number than the rubber compound surrounding them.
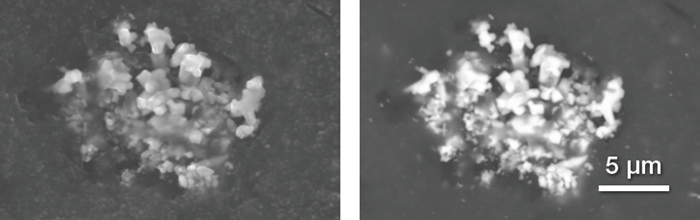
Figure 3. Secondary electrons (left) and backscattered electrons (right) image of a Zn oxide particles cluster. Acc voltage 20 keV, beam current 0.48 nA, acquisition time 40 s. Image Credit: Thermo Fisher Scientific – Electron Microscopy Solutions
While working in a conventional SEM imaging session, Axia ChemiSEM also provides a rapid and comprehensive understanding of the fillers’ composition, seamlessly delivering all required chemical information, without altering the acquisition conditions or methodology.
Thanks to ChemiSEM's full integration within the SEM user interface, X-rays are continuously acquired and processed, even during live imaging or while the previously shown image is acquired. Quantitative elemental maps can be shown with a simple click (Figure 4).
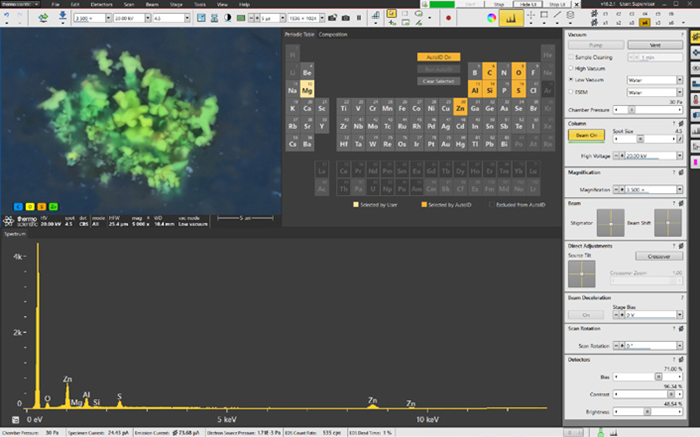
Figure 4. Axia ChemiSEM user interface with integrated live quantitative elemental mapping. It shows the quantitative elemental image during its acquisition, the spectrum of the area acquired, and the periodic table to select/unselect elements of interest. Image Credit: Thermo Fisher Scientific – Electron Microscopy Solutions
Different elements can be selected or deselected within the same acquisition to highlight their distribution (Figure 5). In this instance, the acquisition took 40 seconds for this region of interest. This makes it much easier to locate different filler compositions and much quicker to target locations requiring more detailed analyses.

Figure 5. ChemiSEM quantitative elemental images, showing from left to right respectively all elements shown, zinc distribution and oxygen distribution. Some disuniformities in the distribution may be due to shadowing. Image Credit: Thermo Fisher Scientific – Electron Microscopy Solutions
Figure 6 highlights another abundant filler in the tread (the upper part of the tire cross section). It is clear from this image that the filler in question is very close to the tire’s external surface.

Figure 6. Backscattered electron image showing the position of another type of filler. Image Credit: Thermo Fisher Scientific – Electron Microscopy Solutions
Elemental distributions and quantitative information have been collected and qualify the identified filler as aluminosilicate (Al2 SiO5). These fillers are synthetic additives typically used in the tread to improve compound strength and enhance the rubber’s mechanical properties.
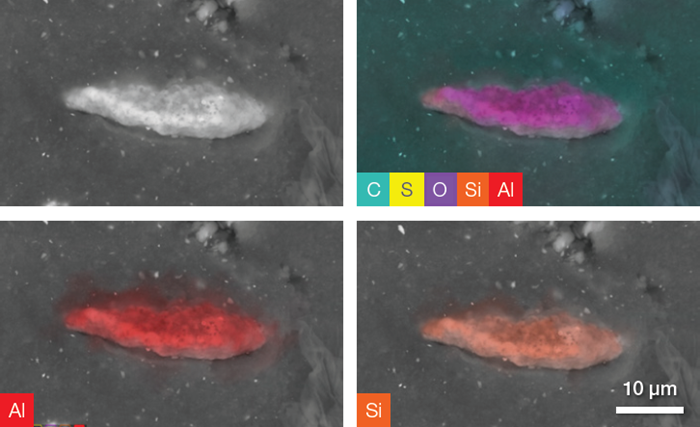
Figure 7. Backscattered electron image and a complete set of quantitative elemental images showing, in the upper right image, all the elements present in the ROI (including C, O and S). The last two images show Al and Si distribution on the particle. Acc voltage 20 keV, beam current 0.94 nA, acquisition time ≈ 100 s. Image Credit: Thermo Fisher Scientific – Electron Microscopy Solutions
Figure 8 shows point analysis confirming that the Al content in the sample is roughly twice that of Si. It is also worth noting that the abundant oxygen signal and the relatively high carbon content likely originate from the underlying rubber.
| Element |
Atomic % |
Atomic % error |
| C |
28.6 |
0.2 |
| O |
52.0 |
0.2 |
| Al |
12.4 |
0.0 |
| Si |
6.8 |
0.0 |
| S |
0.2 |
0.0 |
Figure 8. Point analysis acquired for 60 s. Average count rate ≈ 3000 cps. Image Credit: Thermo Fisher Scientific – Electron Microscopy Solutions
As previously mentioned, fillers are typically used to strengthen and reinforce the rubber structure, but some of these fillers are classified as non-reinforcing or semi-reinforcing fillers2 because they are not designed to improve the mechanical properties. A range of ‘non-black fillers’ are also used in the rubber components, including clay, calcium carbonate, talc, and precipitated silica.
The presented characterizations show two examples of calcium carbonate and talc, respectively. Axia ChemiSEM’s fast and accurate ChemiSEM Technology was used to assign the nature and chemical composition to these specific materials.
Images were collected in the rubber layers below the tread layer, highlighting different compounds with a clear abundancy of the filler calcium carbonate.

Figure 9. Layered filler. From left, backscattered electron image, ChemiSEM image with all the present elements selected, quantitative elemental image showing Ca distribution over the particle. Acc voltage 20 keV, beam current 0.48 nA, acquisition time 40 s. Image Credit: Thermo Fisher Scientific – Electron Microscopy Solutions
A 30-second point analysis was run in the center of the particle, revealing an equal amount of Ca and C and three times the amount of oxygen. These findings confirm that the particle can be assigned to calcium carbonate (CaCO3).
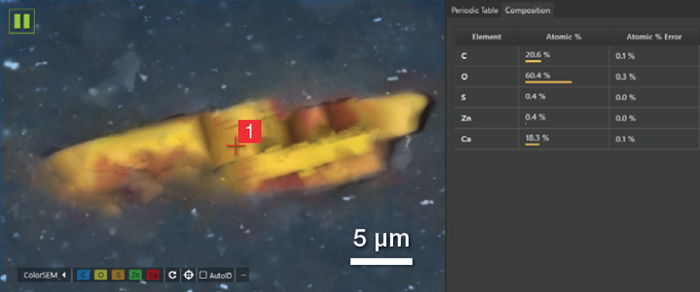
Figure 10. Partial view of the user interface showing the point where the point analysis has been acquired and the related quantification. Acc voltage 20 keV, beam current 0.48 nA, 5000 cps, acquisition time 30 s. Image Credit: Thermo Fisher Scientific – Electron Microscopy Solutions
CaCO3 is classified as a semi-reinforcing filler because this inorganic compound has little capacity to improve the mechanical properties of the whole rubber compound. It has a long history of use in plastics and rubber due to its low cost, with the addition of CaCO3 to increase product volume while limiting the required amount of more expensive natural rubber.
CaCO3 also improves other characteristics, such as the final materials’ hardness, abrasion, and heat resistance.
Figure 11 shows a further example investigation, highlighting other particles with similar composition, but different shapes.
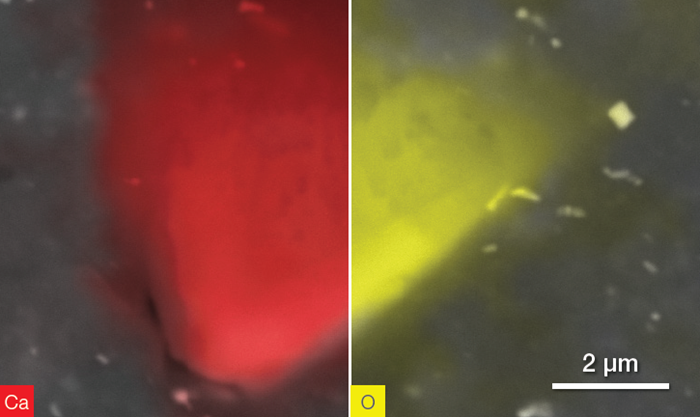
Figure 11. CaCO3 particle. Ca distribution (left) and O distribution (right). Acquisition time 40 s. Image Credit: Thermo Fisher Scientific – Electron Microscopy Solutions
Lastly, another abundant material observed across the tire’s cross-section is a phase commonly referred to as hydrous magnesium silicate. This filler, known as talc (Mg3Si4O10(OH)2), has been used in the rubber industry for more than 40 years. Talc is not used in tread rubber compounds, but it is used in the inner layers of the tire, where it provides higher tear resistance. Talc is, therefore, key to increasing the tire’s durability and toughness.
Figure 12 shows a full set of quantitative elemental maps for one of the many clustered additives located in the subtread and undertread.
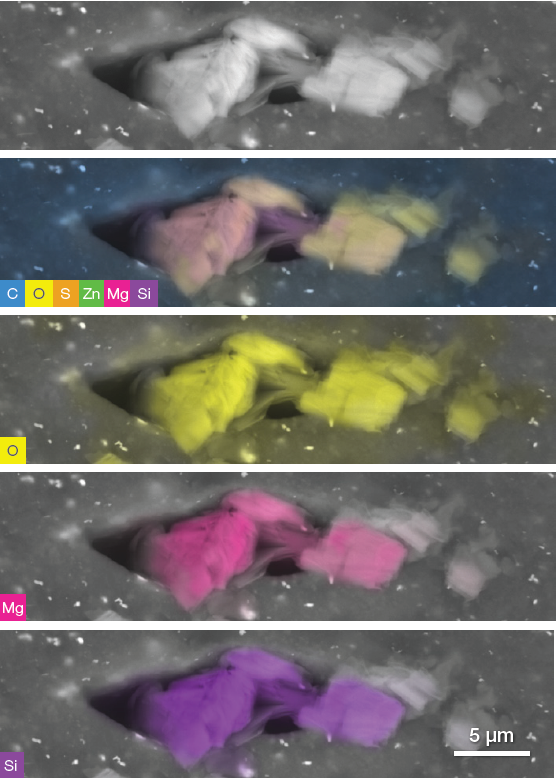
Figure 12. Oxygen, magnesium and silicon rich fillers. The set of images has been acquired in one time by simply saving the conventional greyscale image and then turning on the live quantitative elemental analysis and selecting or unselecting the different elements in order to highlight their distribution. Image Credit: Thermo Fisher Scientific – Electron Microscopy Solutions
The morphology of the imaged filler reveals that these particles feature a plate-like appearance. The combination of crystal habit information and quantitative elemental information offered on-the-fly during the image acquisition, clearly shows that these samples can be classified as talc.
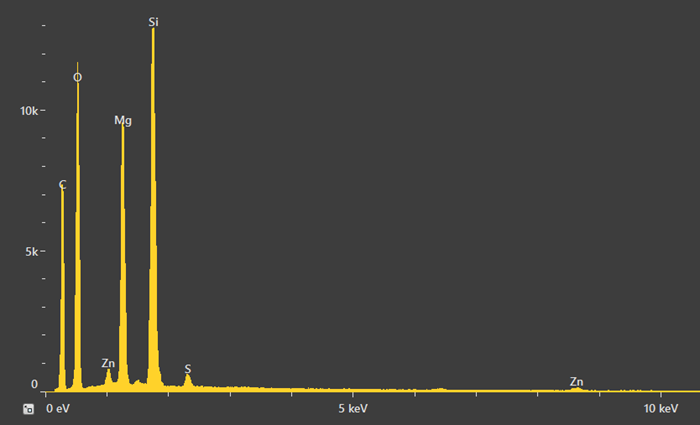
A point analysis was also acquired in order to gain improved understanding of the quantities present. Figure 13 shows a spectrum featuring small peaks for Zn and S, which stem from either the rubber matrix or the comparatively high amount of zinc oxide particles surrounding the ROI.
It is important to note that a high acceleration voltage, for example, 20 keV, generates an interaction volume that also includes a signal from the area surrounding the point of interest.
| Element |
Atomic % |
Atomic % error |
| C |
38.4 |
0.2 |
| O |
44.5 |
0.2 |
| S |
0.3 |
0.0 |
| Zn |
0.3 |
0.0 |
| Mg |
7.5 |
0.0 |
| Si |
9.0 |
0.0 |
Figure 13. Spectrum (top) resulting from the point analysis of the talc particle and related quantification. Acc voltage 20 keV, beam current 0.48 nA, acquisition time 60 s. Image Credit: Thermo Fisher Scientific – Electron Microscopy Solutions
Quantification in this instance confirms that the Mg:Si ratio is approximately 3:4, as it is in talc. Oxygen was found to be slightly higher, but this is likely due to the presence of an oxygen signal from the rubber.
Conclusions
Tire failures are typically associated with the inhomogeneous dispersion of the various fillers present in the tire. A combination of SEM, with contributions from EDS, can be used to understand the root cause of failure in these cases.
This article shows how the challenging task of correctly identifying both the identity and distribution of tire filler materials can be streamlined and improved via the use of the Axia ChemiSEM’s live quantitative imaging and analysis capabilities.
The examples presented here showed how filler materials were correctly identified and their distribution easily observed as a result of the Axia ChemiSEM analytical workflow’s sample centricity.
References and Further Reading
- Brewer HK, C. S. (2006). The Pneumatic Tire. U.S.A: U.S. Department of Transportation, National Highway Traffic Safety Administration.
- Roy, K., Debnath, S.C. and Potiyaraj, P. (2019). A critical review on the utilization of various reinforcement modifiers in filled rubber composites. Journal of Elastomers & Plastics, 52(2), pp.167–193. DOI: 10.1177/0095244319835869. https://journals.sagepub.com/doi/10.1177/0095244319835869?utm_source=researchgate.net&medium=article.
Acknowledgments
Produced from materials originally authored by Thermo Scientific.
Download Thermo Scientific's Automotive eBook

This information has been sourced, reviewed and adapted from materials provided by Thermo Fisher Scientific – Electron Microscopy Solutions.
For more information on this source, please visit Thermo Fisher Scientific – Electron Microscopy Solutions.