Since the 1920s, sheet steel has been the most commonly utilized structural material in the automobile industry, with steel’s strength and stiffness making it ideally suited for durable chassis and welded parts.
Steel is now employed in an ever-expanding range of applications, including food (for example, cans), construction (gears and machinery parts), and wear-resistant tools (such as springs, cutting tools, and high-strength wire).
Steel has also demonstrated its ability to offer unbeatable value for mass production applications compared to other materials.
The varied benefits of steel are evident, but it suffers from one key disadvantage: its low corrosion resistance.
Rust on new and used vehicles continues to pose a problem, with improvements in base metal and galvanized coating quality necessary as recently as the 1970s to further inhibit rust.
Not only does the presence of rust negatively impact a vehicle’s external appearance, but it also compromises its mechanical structure, potentially leading to an early structural failure that adversely affects vehicle safety.
The 1970s saw the use of thicker components as a partial solution to steel corrosion, but these heavy components are no longer a viable option in today’s world of energy-efficient lightweight materials.
A vehicle’s life largely depends on the corrosion resistance of its body, prompting the automobile industry to work on enhancing hot-dip galvanized or electrogalvanized zinc coatings designed to improve oxidation resistance.
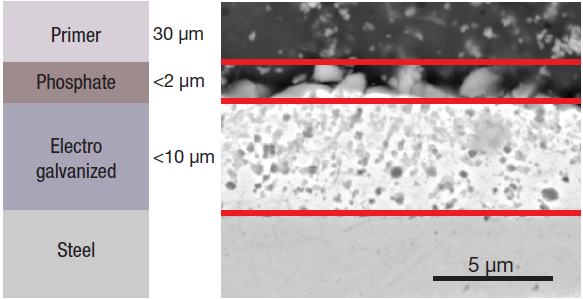
Figure 1. Schematic (left) and SEM image (right) of the different layers. Image Credit: Thermo Fisher Scientific – Electron Microscopy Solutions
Application of the electrogalvanized zinc layer is done in a series of electrolytic cells, with the sheet steel immersed in an alkaline zinc solution. This functions as a cathode, with zinc ions reduced to metallic zinc on the steel surface as an electric current passes through the solution. This results in the creation of a dense and uniform protective layer that is bonded to the steel.
A phosphate layer and a primer for the paint are deposited on top of the zinc metal layer, with a structure similar to the one shown in Figure 1. The zinc phosphate film is applied to provide additional protection for the base metal and enhance the adhesion of the primer. It is porous for this reason.
Standard electrogalvanized coating thicknesses tend to range from 5 µm to 8 µm. Homogeneity is key to ensuring premium adhesive behavior, in terms of the upper layers’ adhesion to the coating and the coating’s adhesion to the metal.
The flatness of the sheet steel surface is also vital because this ensures the availability of a proper substrate for a high-quality coating. The electrogalvanizing can be affected if the surface of the rolled steel is imperfect or altered, potentially impacting the subsequent adhesion of the zinc phosphate and primer, and ultimately resulting in reduced protection from corrosion.
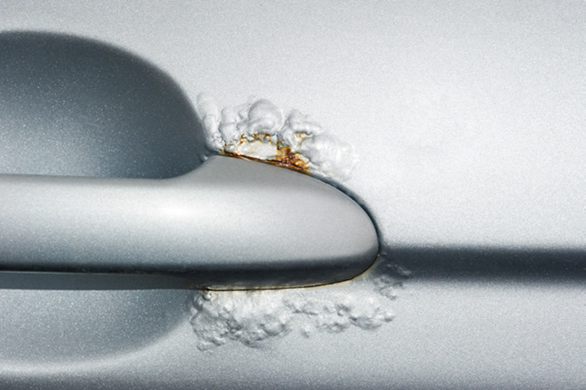
Figure 2. Defective coating on car door. Image Credit: Thermo Fisher Scientific – Electron Microscopy Solutions
Materials and Methods
The defective coating analyzed in the example presented here was sourced from a car door that had been manufactured from ultra-low-carbon, titanium-stabilized steel. The coating is peeling off (Figure 2), meaning it is necessary to determine what is causing the paint to create flakes and progressively detach from the surface of the steel.
This article presents a rapid, straightforward approach to identify the root cause of the automotive coating defect and ensure the removal of any defects prior to the final product reaching customers.
Characterizing the structural and compositional details via scanning electron microscopy (SEM) and energy dispersive X-ray spectroscopy (EDS) is key to achieving these goals.
The combination of the Thermo Scientific™ Axia™ ChemiSEM and its integrated and always-on EDS affords users instant access to both the required compositional data for accurate failure analysis. This approach sees qualitative elemental information directly linked to the SEM image, facilitating considerable time savings.
Analysis
The surface of a defective part sourced from the sample of interest was analyzed. The red square displayed in Figure 3 highlights the area where surface characterization was performed.
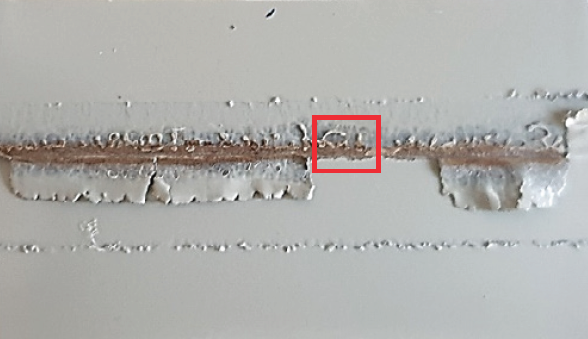
Figure 3. Sample surface. Image Credit: Thermo Fisher Scientific – Electron Microscopy Solutions
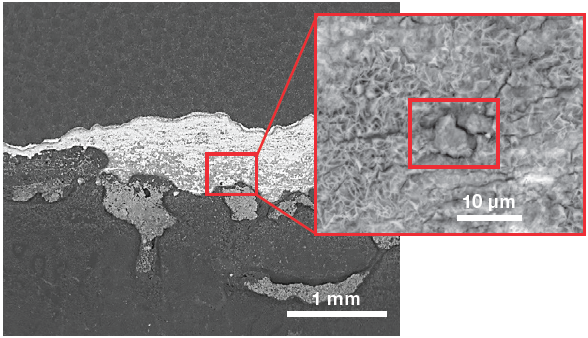
Figure 4. Low-magnification backscattered electron image (left) of the sample surface and a higher magnification of the area of interest (right). (Acc voltage 15 keV, beam current 0.85 nA). Image Credit: Thermo Fisher Scientific – Electron Microscopy Solutions
Figure 4 shows a low-magnification view of the surface of interest acquired using a backscattered electron detector, which provides material-contrast information. The bright region at the center corresponds to a higher mean atomic number material, steel, indicating that this area is not protected by any coating. A higher-magnification image was then collected to examine the defect morphology in more detail and to obtain elemental information.
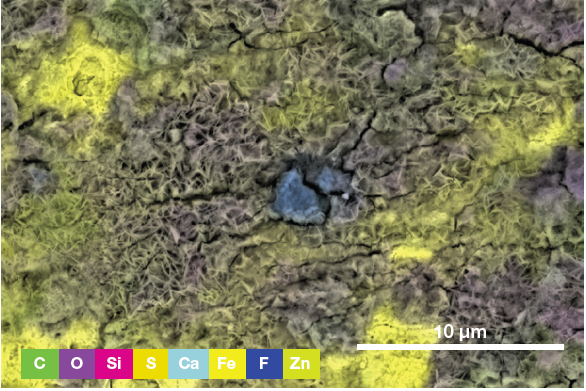
Figure 5. ChemiSEM image showing the distribution of the identified elements (all activated and shown in this view) and their distribution. (Acc voltage 15 keV, beam current 0.85 nA, acquisition time 60 s). Image Credit: Thermo Fisher Scientific – Electron Microscopy Solutions
It is important to note that one of the key benefits of the Axia ChemiSEM is the direct link between the SEM image and EDS signal acquisition. X-rays are collected continuously in the background during standard SEM imaging, providing immediate access to chemical information.
There is no need to switch to another software application, for instance, as with a traditional EDS system, which would see the operator re-acquiring the image, beginning a new EDS data acquisition, and then post-processing the signal by performing tasks such as background removal and addressing peak overlaps.
The quantitative elemental information of the area imaged in Figure 4 can be viewed following a single click, along with the spectrum.
The EDS characterization of the area of interest highlights the presence of a foreign particle in the example presented here. In order to clarify the nature of the particle, users can show or hide certain elements to improve their understanding of the particle composition and elemental distribution.
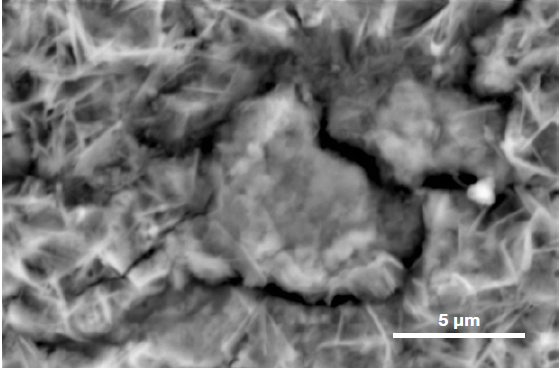
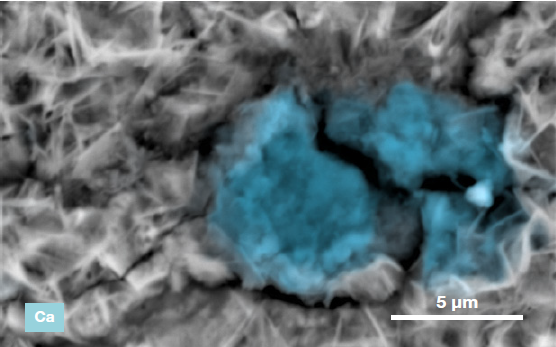
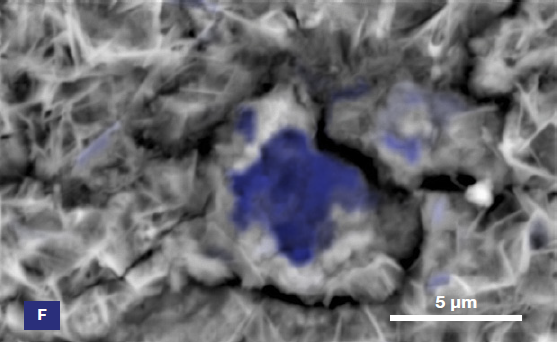
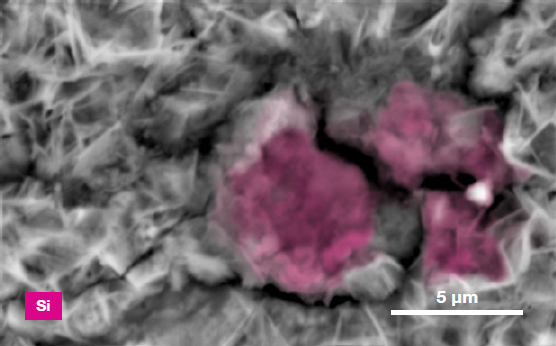
Figure 6. ChemiSEM images of the foreign particle. From top to bottom: backscattered electron image, calcium, fluorine, and silicon distribution. (Acc voltage 15 keV, beam current 0.85 nA, acquisition time 60 s). Image Credit: Thermo Fisher Scientific – Electron Microscopy Solutions
The most abundant elements in the particle were determined to be calcium, silicon, and fluorine. A 30-second area analysis of the defect was acquired, and Figure 7 shows its spectrum with related quantification.
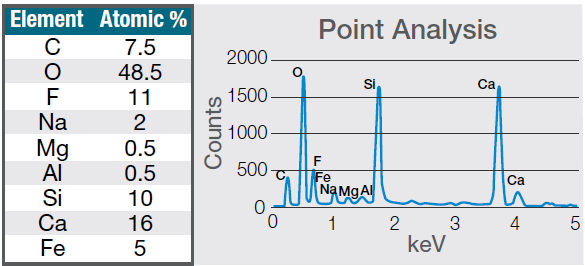
Figure 7. Quantification (left) and spectrum (right) of a 30-seconds area analysis acquired on the defect (Acc voltage 15 keV, beam current 0.44 nA). Image Credit: Thermo Fisher Scientific – Electron Microscopy Solutions
Both the spectrum and quantification of the defect were found to align well with a potential mold powder residue from the continuous casting process used in steel manufacturing.
These mold fluxes are synthetic slags made up of a complex mix of oxides, primarily silica (SiO2) and calcium oxide (CaO). CaO/SiO2 ratios were found to range from 0.7 to 1.3, with viscosity reduced by adding fluorspar (CaF2) and soda (Na2O). Carbonaceous materials are also added to their composition.
Mold powders are used in steel manufacture for different reasons, including:
- Oxidation prevention, whereby the mold flux acts as a barrier that helps avoid steel re-oxidation through contact with air.
- Heat control, in instances where it is necessary to manage heat transfer in the mold.
- Mold lubrication, ensuring lubrication (mold fluxes’ most important function) and avoiding the risk of future cracking of the solidifying steel shell.
Surface inhomogeneities prevent adherence of the zinc protective coating to the steel, resulting in future corrosion. There is also a risk of exogenous inclusions like liquid mold powder droplets entering steel via turbulent metal flow. Additional characterization of the ROI’s cross-section was done for this reason. The presence of subsurface inclusions is confirmed in Figure 8.
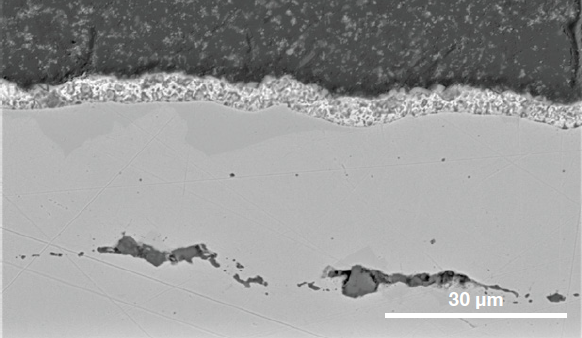
Figure 8. Cross section of the steel showing the coatings involved and the presence of sub-surface inclusions. (Acc voltage 15 keV, beam current 0.44 nA). Image Credit: Thermo Fisher Scientific – Electron Microscopy Solutions
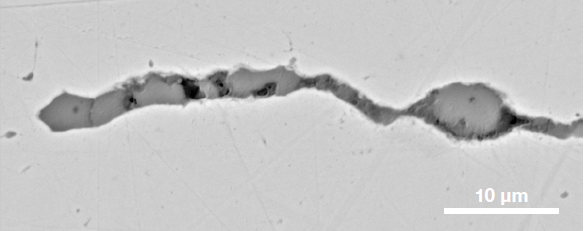
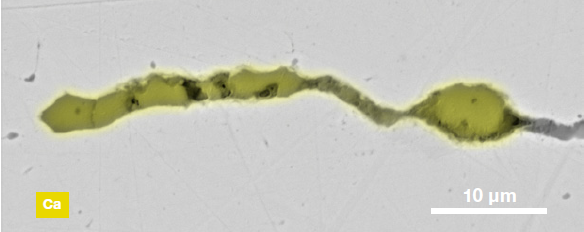
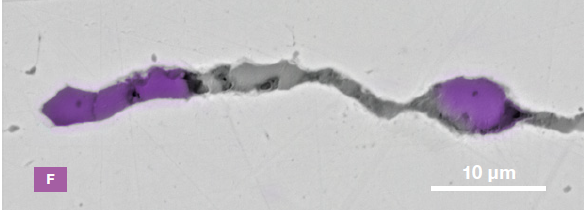
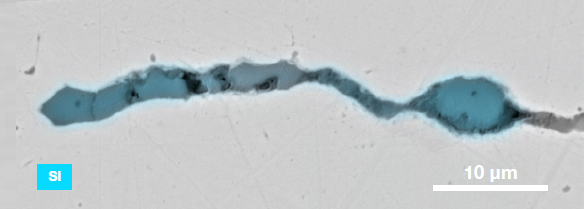
Figure 9. ChemiSEM images of one of the sub-surface inclusions. From top: backscattered electron image, calcium, fluorine, and silicon maps showing their distribution within the inclusions (Acc voltage 15 keV, beam current 0.44 nA). Image Credit: Thermo Fisher Scientific – Electron Microscopy Solutions
The Axia ChemiSEM’s characterization of one of the subsurface inclusions (Figure 9) shows that calcium, silicon, and fluorine are the most abundant elements in the foreign particle on the surface of the sample.
Conclusion
Automotive steel panels (such as roofs, doors, and quarter panels) must offer high durability and corrosion resistance to meet the needs of vehicle manufacturers.
It is essential that all of these components maintain their performance over many years while continuing to guarantee high resistance to atmospheric corrosion. Final products must, therefore, be inspected if they present defects in any of the protective coating layers. This is necessary to understand the root cause of the defect and prevent it from occurring in the future.
This article outlined a procedure that enabled the rapid investigation of the presence of foreign particles alongside a fast and straightforward assessment of the particle’s composition. Unlike traditional SEMs, the Axia ChemiSEM delivers instant access to all required elemental information for accurate defect discovery and failure analysis.
Acknowledgments
Produced from materials originally authored by Thermo Scientific.
Download Thermo Scientific's Automotive eBook

This information has been sourced, reviewed and adapted from materials provided by Thermo Fisher Scientific – Electron Microscopy Solutions.
For more information on this source, please visit Thermo Fisher Scientific – Electron Microscopy Solutions.