In 2014, between 93,000 and 236,000 metric tons (between 15 and 51 trillion pieces of microplastics) were estimated to be present in the world’s oceans.1
Defined as plastic fragments less than five mm in length, microplastics are further classified as primary or secondary, depending on the size of the fragments before entering the environment, with fragments smaller than five mm classed as primary microplastics.
Nanoplastics are less clearly defined, but they are usually considered to be plastic fragments of less than 100 or 1000 nm in size. They can similarly be classified as primary or secondary. But nanoplastics have been less explored, and their impact is still unknown. However, they are considered to pose a higher risk to human and environmental health because of their size, which means they can cross into cellular membranes.
Conventional Analysis Techniques
Microplastics are usually studied and recognized using either Raman spectroscopy or FTIR. If studying particles larger than approximately 10 microns in size, FTIR is often the preferred technique, as it is thought to be a less difficult method.
For smaller particles, Raman spectroscopy is used because of its higher spatial resolution. This method does have, however, many weaknesses, such as low signal, background fluorescence signal, and possible particle damage as a result of the use of laser excitation.2
Photo-Induced Force Microscopy and Spectroscopy
While it is certain that nanoplastics are present, the scale of their concentration is not known due to the unavailability of analytical techniques for nanoscale chemical analysis. However, the emergence of photo-induced force microscopy (PiFM) and photo-induced force infrared (PiF-IR) spectroscopy has proven to be techniques well-suited for such characterizations.
IR PiFM is a great method for analyzing nanoplastics for many reasons:
- Able to classify both the chemical identity and size of particles as small as approximately five nm in size;
- Can identify organic and inorganic nanoparticles;
- ‘Sees through’ fine layers of biological contaminants to recognize underlying nanoparticles;
- Highly sensitive, without concern for fluorescence interference;
- Non-damaging and non-contact measurement capabilities; and
- Simple requirements for sample preparation.
Sample Analysis
To demonstrate PiFM’s capabilities, a research team analyzed a sample that consisted of four unique nanoparticles: PTFE, PMMA, PS, and gold nanoparticles. These particles were drop-cast on a poly-L-lysine substrate.
The sample was expected to serve as a logical proxy for the varied and complicated environmental samples that may require study.
An initial AFM image of the sample’s surface was made using a Vista One IR microscope. Figure 1 shows the topography in both 2D grayscale and 3D formats. If using standard microscopy techniques, it would be impossible to identify the chemical identities of such small particles.
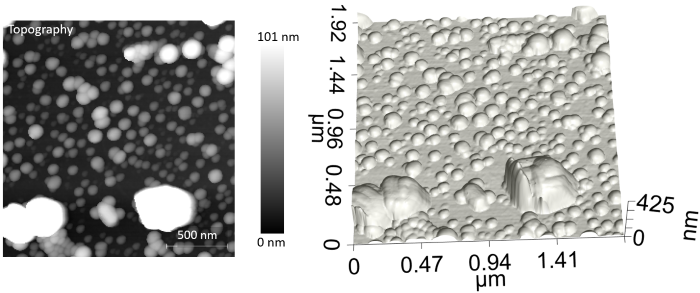
Figure 1. Topography and 3D rendering of the sample surface with four different types of nanoparticles. Conventional microscopy techniques cannot identify chemicals at this small scale. The Vista One was then used to take PiF-IR spectra on different particles in the AFM image. Three unique spectra were obtained, and Figure 2 shows the locations they were acquired from. These spectra were compared to bulk FTIR spectra for each material, which was obtained gleaned from the internet. The PiF-IR spectra from individual particles matched the bulk FTIR spectra closely enough that they can be used to chemically identify the different particles. Image Credit: Molecular Vista
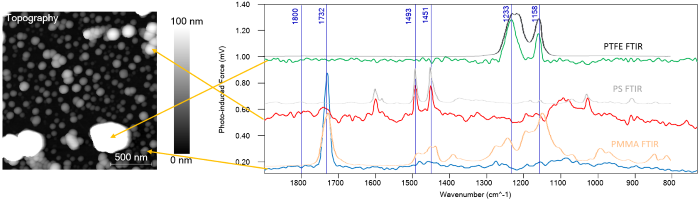
Figure 2. PiF-IR spectra acquired on different particles correspond well with the bulk FTIR spectra for each material, allowing the researchers to identify each nanoparticle chemically. Image Credit: Molecular Vista
Once the material identifications are made, PiFM imaging can be used to create chemical distribution maps. The prominent vibrational bands that correspond with the different particles are used to obtain PiFM images that highlight each nanoparticle type. Images taken at 1732 cm−1, 1158 cm−1, and 1493 cm−1 highlight the PMMA, PTFE, and PS nanoparticles, respectively.
Imaging gold nanoparticles is more complicated since they have no IR-active band. The tip-enhanced field will be greater, however, when the tip is over the gold particles, causing a higher background PiFM signal. Therefore, a wavenumber like 1800 cm−1, where there is no other vibrational band for other particles, can be used to highlight the gold nanoparticles.
Interestingly, PTFE also appears to be highlighted at 1800 cm−1 because of the higher background signals associated with PTFE particles. This could be a result of slightly different mechanical tip-sample interactions when the tip is over PTFE particles.
With this step completed, the team had four PiFM chemical concentration maps that showed the locations of all four types of nanoparticles, seen in Figure 3.
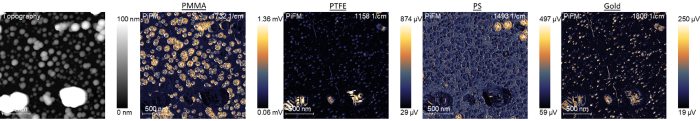
Figure 3. PiFM images at 1732 cm−1, 1158 cm−1, and 1493 cm−1 uniquely highlight PMMA, PTFE, and PS nanoparticles, respectively. A PiFM image at 1800 cm−1 highlights the gold nanoparticles along with PTFE. Image Credit: Molecular Vista
After this, the Vista One’s AFM capabilities can be used to calculate the particles’ true sizes. Figure 4 presents the cross-sections of four representative particles. In AFM, the tip’s radius of curvature will dilate the particle’s lateral size; for any spherical particles, the particle’s height will serve as a good estimate of the particle’s size. Therefore, using these height measurements, the PTFE, PMMA, PS, and gold nanoparticles were measured at approximately 190 nm, 40 nm, 70 nm, and 10 nm in size, respectively.
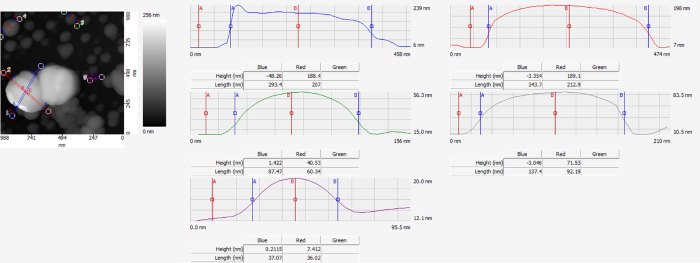
Figure 4. The sizes of the PTFE, PMMA, PS, and gold nanoparticles are about 190 nm, 40 nm, 70 nm, and 10 nm, respectively. Image Credit: Molecular Vista
PiFM chemical maps can be merged and overlaid onto 3D AFM topography to present this dataset into a single image. Figure 5 shows the result with different colors for each type of nanoparticle: green for gold and PTFE, red for PS, and blue for PMMA. An image like this provides an easily understandable view of the sample, making it evidence that one could not use size or other clues from topography alone to classify the nanoparticles. This demonstrates the indispensable features PiFM and PiF-IR are providing when analyzing complex nanoscale systems.
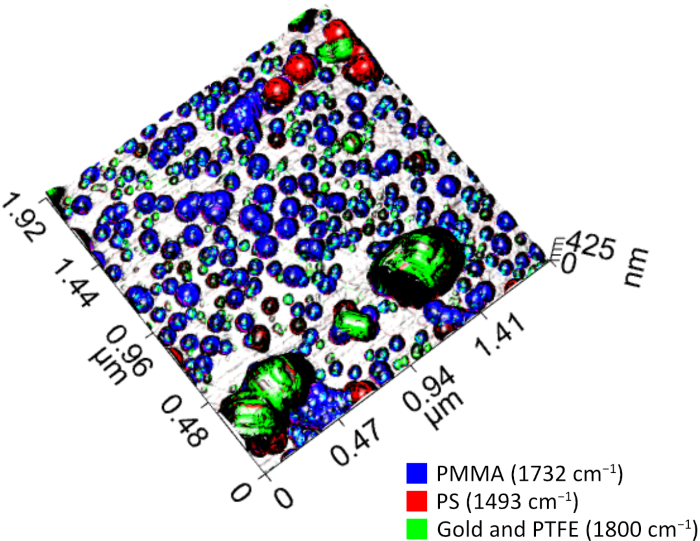
Figure 5. A composite of three PiFM images is overlaid on the 3D topography to highlight different nanoparticles with different colors. Image Credit: Molecular Vista
Conclusions
PiFM and PiF-IR can chemically recognize and calculate the sizes of nanoplastic particles along with other inorganic and biological nanoparticles for environmental forensics with unmatched spatial resolution.3 The presented sample acts as an analog for the types of complex systems that may be seen in environmental samples, demonstrating that PiFM and PiF-IR fill an important role in contemporary microscopy practice.
References
- Erik van Sebille and Kara Lavender Law (2019). Far more microplastics floating in oceans than thought. (online) The Conversation. Available at: https://theconversation.com/far-more-microplastics-floating-in-oceans-than-thought-51974.
- Araujo, C.F., et al. (2018). Identification of microplastics using Raman spectroscopy: Latest developments and future prospects. Water Research, 142, pp.426–440. DOI: 10.1016/j.watres.2018.05.060. https://linkinghub.elsevier.com/retrieve/pii/S0043135418304421.
- Molecular Vista. (2025). Applications | Molecular Vista. (online) Available at: https://molecularvista.com/applications/.

This information has been sourced, reviewed, and adapted from materials provided by Molecular Vista.
For more information on this source, please visit Molecular Vista.