Surface functionalization using SAM (self-assembled monolayer) coverage is used in a variety of fields, including microfluidics, biosensors, semiconductor processes, biotechnology, medical implants, wearable technologies, and lab-on-a-chip devices. But it can be surprisingly tricky to determine the state and quality of surface functionalization, considering its critical role.
Most analytical methods with molecular identification capabilities (like Raman, water contact angle measurement, FTIR, XPS, and even ToF-SIMS) average over nanoscale inhomogeneity. Microscopy techniques with nanoscale resolution, such as atomic force microscopy (AFM), are often used to evaluate a surface’s topography, with the assumption that any aggregates or extrusions present show heterogeneous or incomplete functionalization.
A uniformly flat microscopy image can be unclear, however, since it could correspond to either an unmodified substrate or to a fully functionalized, entirely flat monolayer. Image-based analysis alone is, therefore, not enough to confirm SAM coverage quality.
Current Methods
This limitation is demonstrated in Figure 1, where two surfaces, both exhibiting approximately one nm of height variation, appear topographically the same with a few clusters of particulates.
Monolayer formation remains uncertain, despite both samples having undergone attempted peptoid functionalization. It is impossible, therefore, to distinguish between successful and unsuccessful functionalization if looking solely at these AFM figures.
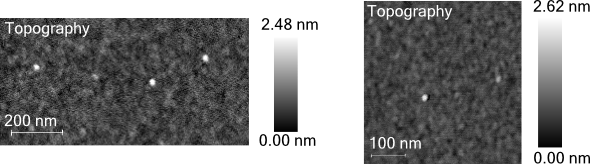
Figure 1. Two AFM images taken from samples with SiOx/ silicon substrate and an attempted monolayer with peptoids. Image Credit: Molecular Vista
If using the AFM alone, one cannot observe that only one of these surfaces has a successful monolayer. Photo-induced Force Microscopy (PiFM) overcomes this restriction by concurrently providing high-resolution topographical imaging and nanoscale FTIR-like PiF-IR spectra with spatial resolution as low as five nm.
By combining these functionalities, chemical characterization of the surface can be performed, resulting in data that can be used to differentiate between a bare substrate and a functionalized surface.
The AFM image seen on the right-hand side of Figure 1 was analyzed using Molecular Vista’s PiFM system. PiF-IR point spectra were collected on the flat regions (the orange, gold, purple, and light blue spectra as shown in Figure 2). These spectra show repeatable peaks at ~800 cm−1, 1020 cm−1, 1100 cm−1, and 1260 cm−1, suggestive of siloxane contaminants, in addition to further peaks ascribable to hydrocarbons at approximately 1725 cm−1, 1460 cm−1, and 1370 cm−1.
The consistent intensity of these contaminant peaks shows that the contaminants are dispersed homogeneously across the surface. The PiF-IR point spectra obtained on the clusters (red and green spectra) show that the amide peak at ~ 1650 cm−1 is congruous with the dominant FTIR peak for the peptoid shown in red above the PiF-IR spectra. This proves that in this sample, peptoid molecules were only able to cluster together, and they could not form a monolayer.
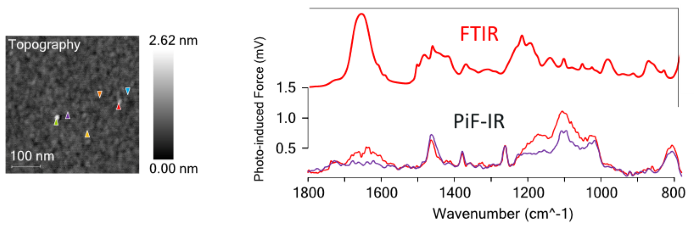
Figure 2. The colored triangles in the AFM image on the left correspond to the location where the same-colored spectra were acquired. The red and light green PiF-IR spectra are obtained from the surface aggregates. The remaining spectra are acquired from the flat sections. The single, red FTIR spectrum is separately acquired from a bulk sample of the peptoid. Image Credit: Molecular Vista
In contrast, Figure 3 shows that PiF-IR point spectra obtained from the locations marked by triangles on the left of the AFM image routinely have peaks at 1658 cm−1 and 1447 cm−1, as can be seen from the spectra on the right.
These signals are typical of peptoid functionalization. The strong reproducibility of these PiF-IR spectra across the surface confirms that a uniform peptoid layer is present.
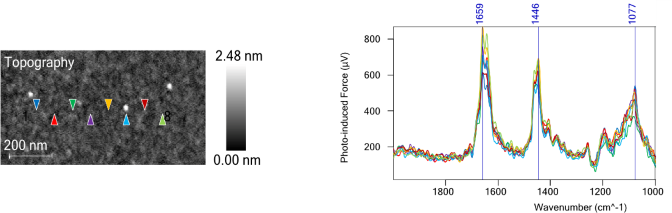
Figure 3. PiF-IR Spectra taken from various points on the AFM image. The colored triangles correspond to the location where the same-colored spectra were acquired. See the strong reproducibility. Image Credit: Molecular Vista
These results prove that, even if surfaces appear identical by AFM, they can be chemically unique, since PiFM enables the detection of both localized contamination and functionalization.
Patterned SAM
Surface functionalization often must be constrained to nanoscale surfaces, as in directed self-assembly, nanoparticle functionalization, selective ALD, etc. In such situations, the analytical technique must possess both monolayer sensitivity and nanoscale lateral spatial resolution.
To prove this ability, the sample from Figure 3 was e-beam patterned to create a line-space pattern with a linewidth of approximately 100 nm (170 nm pitch). AFM topography of the pattern (left side of Figure 4) demonstrates that the polypeptoid brush monolayer is around one nm thick.
Two PiFM images acquired at 1658 cm−1 (peptoid signal) and 1113 cm−1(SiO2/Si substrate signal) are merged to create the pattern’s chemical map.
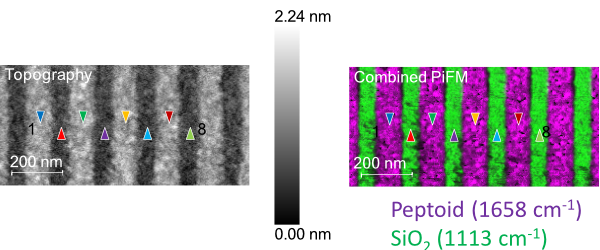
Figure 4. AFM image. Left side: after e-beam patterning the peptoid film from Figure 3. The colored triangles are points where PiF-IR spectra (Figure 5) are taken. Right side: two PiFM images acquired at 1658 cm−1 and 1113 cm−1 combine to highlight the peptoid molecules and the substrate. Image Credit: Molecular Vista
PiF-IR spectra (Figure 5) acquired from the substrate regions (red, purple, blue, and light green triangles) exhibit a prominent peak at 1113 cm−1, emblematic of the underlying SiO2/Si substrate, with no peptoid-associated peak at 1658 cm−1.
Conversely, PiF-IR spectra obtained from the taller regions (blue, dark green, yellow, and dark red) contain the same 1658 cm−1 peptoid peaks. Note the excellent signal-to-noise observed in PiF-IR spectra even when observing a one-nanometer-thick monolayer.
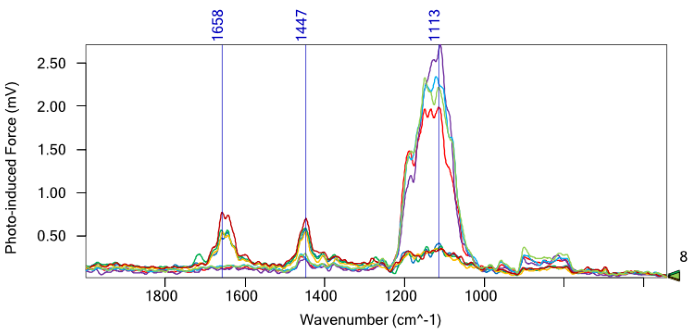
Figure 5. PiF-IR spectra of the e-beam patterned sample. The colored triangles in Figure 4 correspond to the location where the same-colored spectra were obtained. These findings prove that PiFM permits the monolayer detection of molecules with true nanoscale spatial resolution. Image Credit: Molecular Vista
Conclusion
This study establishes PiFM as a clear and robust technique for the concurrent characterization of surface topography and chemical composition at the nanoscale. PiFM addresses the limitations of multiple legacy techniques by providing direct, spatially resolved chemical mapping, representing a powerful instrument for the comprehensive evaluation of surface functionalization in bio-interface research and advanced materials.
References
- Yu, B., et al. (2024). Nanopatterned Monolayers of Bioinspired, Sequence-Defined Polypeptoid Brushes for Semiconductor/Bio Interfaces. ACS Nano, 18(10), pp.7411–7423. DOI: 10.1021/acsnano.3c10204. https://pubs.acs.org/doi/10.1021/acsnano.3c10204.
- Molecular Vista. (2023). Precise Testing of Surface Modification and Functionalization | Molecular Vista. (online) Molecular Vista. Available at: https://molecularvista.com/surface-functionalization-webinar-052023/.

This information has been sourced, reviewed, and adapted from materials provided by Molecular Vista.
For more information on this source, please visit Molecular Vista.