For the successful hybrid bonding of Cu-Cu to occur in highly demanding, sophisticated packaging, the two mating dielectric surfaces, often silicon oxides, must bond effectively at low temperatures.
It has been well documented that hydrophilic silicon wafers bond together easily at RTP.1 Hydrophilic silicon surfaces are generally realized by Si-OH termination. It can be tricky, however, to detect when surfaces have been effectively prepared.
A layer of physisorbed water less than 0.6 nm thick has been successfully measured on a clean silicon surface at approximately 40 % relative humidity. Taking this measurement was achieved using a silicon substrate as an attenuated total reflection (ATR) crystal, prepared in a way that circa 35 internal reflections were created, helping to increase the SNR.2
This measurement method, though impressive, is not practical for taking routine measurements. It is also a macroscopic technique averaging over hundreds of microns of sample surface.
A similarly extensively used macroscopic method is a water contact angle measurement. It has been proven, however, that there are crucial differences between macro- and microscopic hydrophobicity (measured by water contact angle) when there is heterogeneity on the surface.3
Legacy analytical techniques, such as EDX and ToF-SIMS, are not able to accurately detect the presence of such a thin layer of water locally.
In this article, PiF-IR spectra are used to follow the adsorption and desorption of water molecules as a silicon surface sustains cleaning and heating procedures.
Experimental
28 PiF-IR spectra are acquired in a seven-by-four grid pattern over an area of 2 µm × 1 µm. Acquiring each spectrum took 20 seconds. The same laser power and tip and were utilized to remove potential experimental variability.
The same sample was tested at five different conditions: (1) as is, before cleaning; (2) at room temperature after UV ozone cleaning; (3) at 50 °C; (4) at 80 °C; and (5) after returning to room temperature.
Results were recorded with negligible waiting time between measurements for conditions two through five. All measurements were conducted with a continuous flow of dry air in the measurement chamber.
Results and Discussion
Figure 1 plots the PiF-IR spectra acquired in each of the different environments. Figure 1a shows all 28 spectra at each of the five conditions, whereas Figure 1b shows the average spectra at each condition, on a magnified y-scale.
The figure also shows the -OH spectral locations associated with two different types of water layers that form on a silicon surface: an ice-like water layer that forms on the silicon’s surface through hydrogen bonding with Si-OH, and the loosely-bound amorphous layer that forms on the ice-like layer’s surface.2
A blue tint represents the spectral region associated with this ice-like layer, and the region associated with the amorphous layer is highlighted in green.
The lowest shown spectra are from a silicon coupon without any cleaning (“as-is”). From Figure 1a, the spectra from the 28 different locations are fairly repeatable, showing broad peaks at the wavenumbers associated with both the ice-like and amorphous water layers.
There are, however, weak IR peak strengths, indicating a less dense water molecule network; the average spectrum shown in panel 1b more obviously presents the two broad peaks.
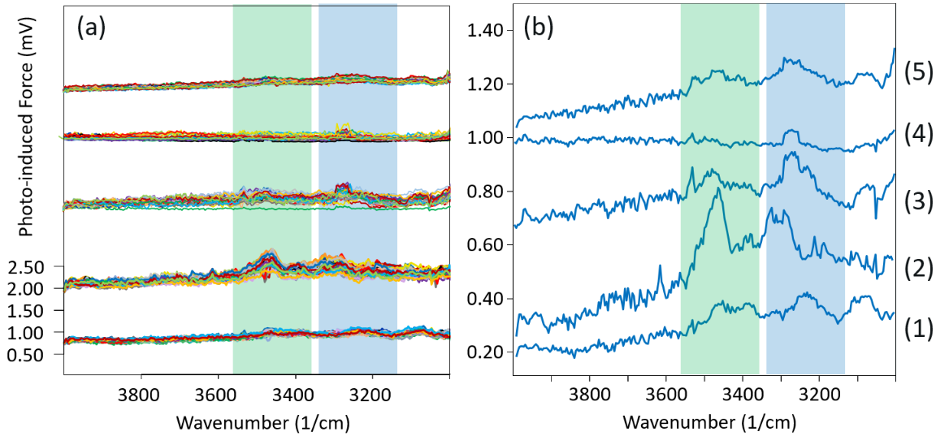
Figure 1. PiF-IR spectra from the same silicon sample were acquired at five different conditions. Conditions (1), (2), (3), (4), and (5) correspond to “as is”; “after UV ozone cleaning at room temperature”; “after UV ozone cleaning at 50 °C”; “after UV ozone cleaning at 80 °C”; and “after returning to room temperature”, respectively. Panel (a) shows spectra from 28 locations plotted on top of each other, while panel (b) shows average spectra. Green and blue tints highlight the spectral ranges associated with both the amorphous and ice-like water layers, respectively. Image Credit: Molecular Vista
The group seen second from the bottom is associated with condition two, in which the silicon sample underwent 15 minutes of UV ozone cleaning. As previously noted, the measurements were all taken with the same laser power and tip, ensuring direct comparison of the spectra in the different conditions.
It should be noted that the broad peaks for both water types increase greatly from the “as-is” condition, which can be seen most clearly in panel 1b, indicating a far denser network of physisorbed water.
From panel 1a, it is evident that the spectra taken from different locations are less repeatable, indicating a uniform surface is not produced following the UV ozone cleaning process, at least when performed at the sub-5 nm length scale, which is the spatial resolution of PiF-IR.
To ensure that only the OH vibrations from the physisorbed water layers were measured, the measurements were repeated at higher temperatures. Existing literature suggests that the amorphous water layer should be less tightly bound, therefore making it less difficult to remove at lower temperatures than the ice-like layer.
The first test at a higher temperature was performed at 50 ºC. The spectra for this experiment are depicted third from the bottom in Figure 1. To understand the effect heating had, a concerted effort was made to rapidly increase the temperature, to begin gathering the PiF-IR spectra as fast as possible. There was approximately only one minute between the room temperature measurement and the first measurements taken at 50 °C.
From the average spectrum, shown in Figure 1b, it can be seen that the broad peak associated with the loosely bound amorphous water layer (green shaded range) decreases significantly when compared to the broad peak linked to the ice-like water layer (blue shaded range). Even though measurements are not taken sufficiently quickly to capture dynamics, the stochastic nature of the water desorption process can nonetheless be observed.
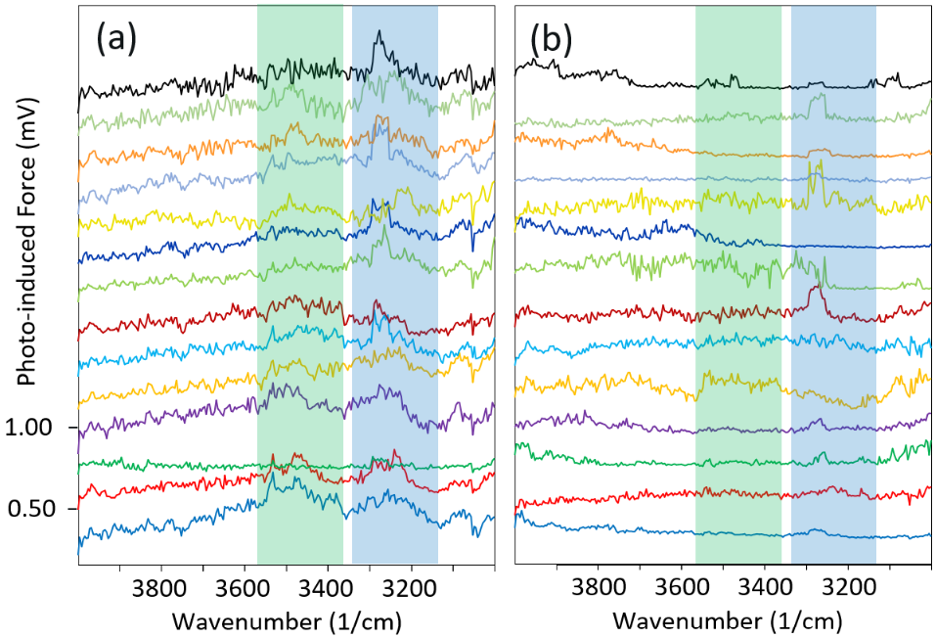
Figure 2. The first 14 PiF-IR spectra (from 14 different locations) are plotted offset from each other, starting at the bottom. Since each spectrum took 20 seconds to acquire, the figure shows the time progression over the first five minutes approximately: measurements (a) at 50 °C and (b) at 80 °C. Green and blue shades highlight spectral ranges associated with amorphous and ice-like water layers, respectively. Image Credit: Molecular Vista
Figure 2a shows the first 14 PiF-IR spectra acquired at 14 different locations on the sample at 50 °C. The first spectrum is the lowest of the plot, and subsequent PiF-IR spectra are acquired in roughly 20-second intervals at different locations, plotted on top of the previous spectrum. Therefore, Figure 2 shows the temporal progression of the measurement from bottom to top.
Somewhat as expected, the broad peak associated with the amorphous water layer is initially strong but weakens as time passes, whereas the peak associated with the ice-like water remains fairly robust throughout, even as the peak shape morphs slightly. Straight after the measurements were completed at 50 °C, the sample was heated to 80 °C, and more PiF-IR spectra were acquired immediately.
There was, as before, less than one minute between the measurement at 50 °C and the start of the 80 °C measurement. These spectra are shown in the fourth group from the bottom in Figure 1. In these results, there is no evidence of the loosely bound amorphous water layer. There is, however, a small peak for the ice-like water layer.
When one considers the individual PiF-IR spectra in sequence to observe the time progression (Figure 2b), a flat IR signal is observed at most locations. These flat spectra indicate that there are no water layers on the surface at those locations, nor any ice-like or amorphous layers.
At a few locations, an IR signature is present that potentially indicates the presence of some ice-like water on the surface. This is consistent with the fact that the ice-like water layer is held more firmly with the substrate, so traces of this layer will still be seen at this increased temperature.
When the sample returns to the RTP through cooling, water molecules from the ambient physisorb back onto the surface. The PiF-IR spectra associated with this condition are presented at the top of the plot in Figure 1.
They resemble the spectra associated with the “as-is” silicon substrate that had not been cleaned, which is an expected outcome considering that the heating experiment was conducted in an unclean environment (i.e., not an HV or UHV environment).
Conclusion
IR PiFM can chemically identify the presence of both ice-like and amorphous water layers on hydrophilic surfaces with good SNR. Even a single 20-second spectrum can provide a clear IR signature associated with -OH bonds, which should prove to be invaluable for characterizing surface treatments for a variety of diverse applications.
References
- Tong, Q. Y. et al. (1997) The Role of Surface Chemistry in Bonding of Standard Silicon Wafers. The Journal of Physical Chemistry C. DOI:10.1149/1.1837415. https://iopscience.iop.org/article/10.1149/1.1837415.
- Chen, L., et al. (2018). Water Adsorption on Hydrophilic and Hydrophobic Surfaces of Silicon. Journal of Physical Chemistry C, 122(21), pp.11385–11391. DOI: 10.1021/acs.jpcc.8b01821. https://pubs.acs.org/doi/abs/10.1021/acs.jpcc.8b01821.
- Ivanova, A., et al. (2022). Live imaging of micro and macro wettability variations of carbonate oil reservoirs for enhanced oil recovery and CO2 trapping/storage. Scientific Reports, [online] 12(1). DOI: 10.1038/s41598-021-04661-2. https://www.nature.com/articles/s41598-021-04661-2.

This information has been sourced, reviewed, and adapted from materials provided by Molecular Vista.
For more information on this source, please visit Molecular Vista.