As the use of MEMS devices began to grow at the turn of the century, characterization of their motion became increasingly important, both for evaluating performance and for developing process-optimization measures.
Image Credit: Polytec
The introduction of integrated functionality into MEMS devices, such as the incorporation of thin piezoelectric layers, led to innovative devices that required extensive measurement and characterization under ambient conditions typical of the devices' operational state.
Manufacturing processes can cause changes in residual stresses, which degrade device performance and pose additional measurement challenges. There was an urgent need for a way to evaluate the performance of these functional materials at such small scales.
Introduction
The National Physical Laboratory (NPL) is the UK's national standards laboratory and an internationally recognized, independent center of excellence for R&D and knowledge transfer in measurement and materials science.
The Functional Materials group at NPL combined an environmental chamber with a Polytec micro-scanning laser Doppler vibrometer to characterize MEMS devices at the nanoscale under a variety of vacuum circumstances.
They created a dedicated laser Doppler vibrometer (LDV)-based test station to examine the motion of MEMS devices over a wide range of pressures, from 1 bar (atmospheric) to 10-5 mbar.
Experimental Setup
A diaphragm-backed turbomolecular pump pumps the samples, ensuring an oil-free environment for testing. The LDV laser beam enters the sample through a specially coated covered glass window, providing effective RFI/EMI shielding while maintaining optical clarity.
Figure 1 shows the MEMS vacuum chamber, which contains standard ports for computer control of the vacuum stages. Sample excitation for dynamic analysis is provided by electrical feedthroughs.
The sample chamber was designed for future upgradeability, including the ability to investigate sample mobility as a function of temperature and humidity.
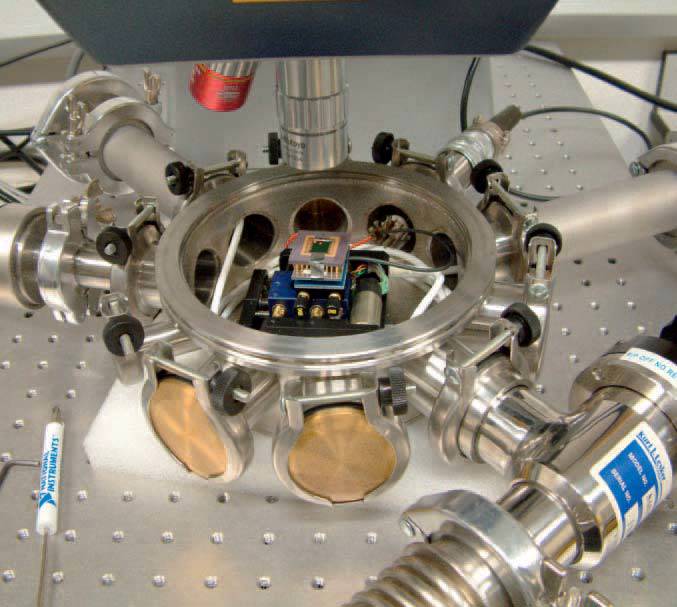
Figure 1. Photograph of the environmental chamber, showing a sample attached to the vacuum-compatible XY stages. The long-focal-length lens can be seen above the sample, which is attached to the Polytec Micro Systems Analyzer Differential Vibrometer. Image Credit: Polytec
Benefits of Polytec’s MSA-400 Micro System Analyzer Combined with a Vacuum Chamber
NPL's method used a Polytec scanning differential vibrometer (Polytec MSA-400- PM2-D Micro method Analyzer, with out-of-plane and in-plane measuring capability) with long working distance objective optical lenses to reduce the beam size to one micrometer.
This method classified samples with lateral diameters under 10 μm. The Polytec system was selected due to its small spot size and, consequently, its high lateral spatial resolution, its ability to measure through a vacuum window, and its differential measurement capability, which eliminates relative motion between the tested device and its supporting framework.
Device excitation can be performed using broadband stimuli, such as periodic chirps and white noise, or single-frequency waveforms, such as sine or square waves. Scanning the laser across the sample yielded velocity or displacement profiles that demonstrate out-of-plane motion with a resolution of more than 10 pm.
In normal operation mode, the sample was scanned using the MSA-400's internal optics. For larger samples (up to 25 mm), NPL included a set of X-Y vacuum-compatible stages in the MEMS chamber.
These stages are typically used for sample positioning and alignment, but they can also be used to scan the sample and provide a motion profile.
The combination of a scanning unit with a dedicated, flexible design vacuum chamber enabled the study of devices under more realistic operating conditions, including the investigation of specific effects such as air damping and friction.
Sophisticated Data Processing
For data analysis, the velocity signal from the vibrometer controller was sent into a lock-in amplifier (Stanford Research Systems SR830). This setup had two objectives.
First, it made it easy to extract velocity/displacement and phase information. Second, the adoption of lock-in techniques reduced noise levels during single-frequency vibrational acquisition, enabling far lower excitation voltages.
In this study, a frequency sweep was first recorded to determine the position of a piezoelectric MEMS device's resonant peaks, which were then mapped using laser or sample scanning.
Example One: Piezoelectric (PZT) Transducer Membrane
Tests on a macroscale PZT membrane (4 mm in diameter, shown in Figure 2) and an atomic force microscopy (AFM) tip (Figure 3) demonstrate the scale at which the scanning vibrometer system operated.
Measurements of both samples were taken in air (data not shown) and vacuum to compare the effects on their dynamic response.
The PZT membrane, when directly activated by applying a sinusoidal voltage between the top (inner) and bottom electrodes, displayed a fundamental mode of vibration at a frequency of 20.78 kHz in air and 17.81 kHz in a vacuum at 4 x 10⁻⁵ mbar (see Figure 4).
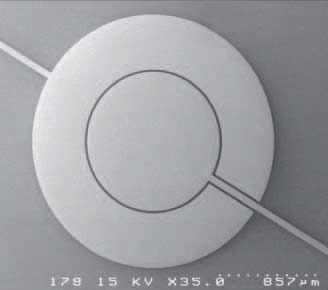
Figure 2. SEM image of the 4 mm diameter PZT circular membrane. Resonant modes are shown in the image to the right. Image Credit: Polytec
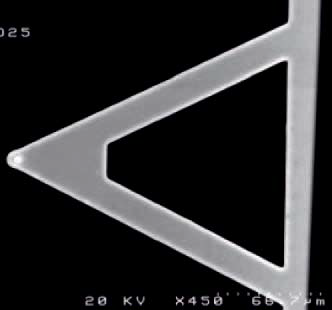
Figure 3. SEM image of the Veeco UltraleverTM AFM tip. Resonant modes are shown below. Image Credit: Polytec
This decrease in frequency was induced by a sealed air gap between the sample membrane and the mounting substrate. For ‘freely’ vibrating samples, lowering the pressure caused an increase in frequency due to the reduction in air damping acting on the sample.
In addition to the usual higher-order harmonics, other vibrational modes can be recognized, which would be more difficult to detect with a single-point vibrometer.
For smaller devices, laser scanning can save time compared to physically scanning the sample and also reduce the effects of lateral motion and backlash in the scanning stages. Based on the required spatial resolution and frequency range, a complete scan of out-of-plane motion can be completed in minutes.
Example Two: AFM Tip
Findings from the AFM tip (feature size of approximately 20 μm, as seen in Figure 3) show the system's lateral resolution. A typical V-shaped cantilever used for contact-mode AFM was scanned in air and in vacuum.
The cantilever's resonant frequency was determined to be 62.12 kHz in air and 62.59 kHz at a pressure of 3 x 10⁻⁵ mbar, with the amplitude of vibration increasing by a factor of nearly 50 (Figure 5).
The rise in resonant frequency and higher quality factor observed at lower operating air pressures can be attributed to a decrease in the frictional energy-dissipation forces the cantilever encountered as it resonated in its local environment.
This data was then compared with a software-modeled response using techniques such as finite element analysis. Knowing the fundamental frequency of the tip enables the computation of the force constant, which could then be compared to the numbers provided by the manufacturer - a fundamentally crucial feature of all AFM probes.
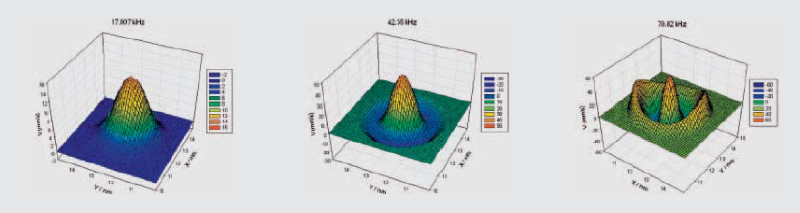
Figure 4. Resonant modes of the PZT membrane obtained under a vacuum of 4 x 10⁻⁵ mbar (fundamental, first and second order). Image Credit: Polytec
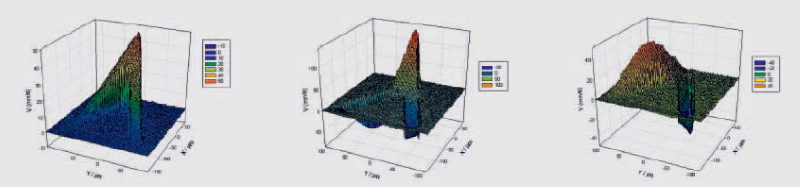
Figure 5. Maximum amplitude resonant modes of the AFM tip obtained under a vacuum of 3 x 10⁻⁵ mbar. Image Credit: Polytec
Example Three: SNOM Gold Probe
Figure 6a shows an example of data collected using NPL's method with a 250 μm-diameter gold probe for a scanning near-field optical microscope. A tiny piezo element with an amplitude of roughly one nanometer drove an etched gold probe at resonance, allowing the SNOM to function properly.
This amplitude was kept small to minimize the area over which data were collected. The initial effort consisted of evaluating a relatively long probe (approximately 6 mm). Scanning the length of the probe reveals that the mode previously assumed to be the fundamental mode of vibration was actually a higher-order harmonic vibration.
If the probe was activated at this higher frequency, the SNOM process would become more complicated. Figure 6b illustrates the frequency response of the tip of a shorter probe (length approximately two mm).
The probe can create a tip movement of one nanometer at a resonance frequency of 22.06 kHz with approximately 0.6 mV of voltage.
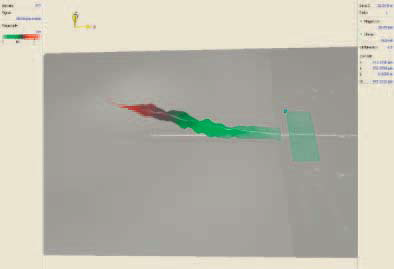
Figure 6a. Scanning LDV of the SNOM gold probe. Image Credit: Polytec
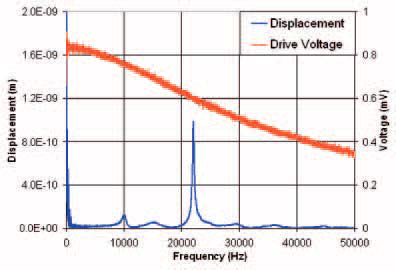
Figure 6b. Frequency response from a 2 mm long Au SNOM tip. The LDV image shows that the fundamental mode is indeed excited, rather than a higher-order harmonic mode. Image Credit: Polytec
Conclusions and Outlook
The work presented here focuses on acquiring high-resolution vibrometry scans of several samples of interest. NPL's Polytec MSA-400-PM2-D (differential) Micro System Analyzer provides the benefits of quick data gathering and processing via FFT analysis, as well as in-plane vibrational analysis.
When paired with NPL's vacuum chamber, which operates at 10-5 mbar and can be controlled for temperature and humidity, this created a one-of-a-kind characterization system for the dynamic in-plane and out-of-plane study of MEMS and macro-sized devices.
In addition to these samples, velocity and displacement profiles were obtained from several other samples, including active and passive MEMS devices.
Animated movies of some of these vibration modes can be found at www.npl.co.uk/materials/functional/ mpp1_3_4.html
The MSA-500
In addition to the MSA-400 used for these tests, the MSA-500 - another early twenty-first century innovation - included Autofocus and Geometry Scan, which expanded the vertical measuring range and provided a complete 3D perspective of vibrations.

This information has been sourced, reviewed, and adapted from materials provided by Polytec.
For more information on this source, please visit Polytec.