Thermo Scientific has set the standard for the highest quality in metal spectrochemical analysis since 1934. The company’s optical emission spectrometers have long been known for their stability, precision, durability, performance, and lifespan.
ARL iSpark 8860 Plus Metal Analyzer Overview
The Thermo Scientific™ ARL iSpark™ 8860 Plus Metal Analyzer is an example of a system that incorporates cutting-edge advancements to meet today's optical emission needs.
This analyzer accurately and quickly measures all the elements of interest to meet customers’ current and future requirements in all pure and ultra-pure aluminum grades.
It meets analytical requirements for incoming material control, process QC, final product QC, certification, and investigation. The ARL iSpark 8860 Plus Metal Analyzer operates 24 hours a day, seven days a week, and delivers dependable performance year after year. This article delivers specific details about the system’s performance capabilities.
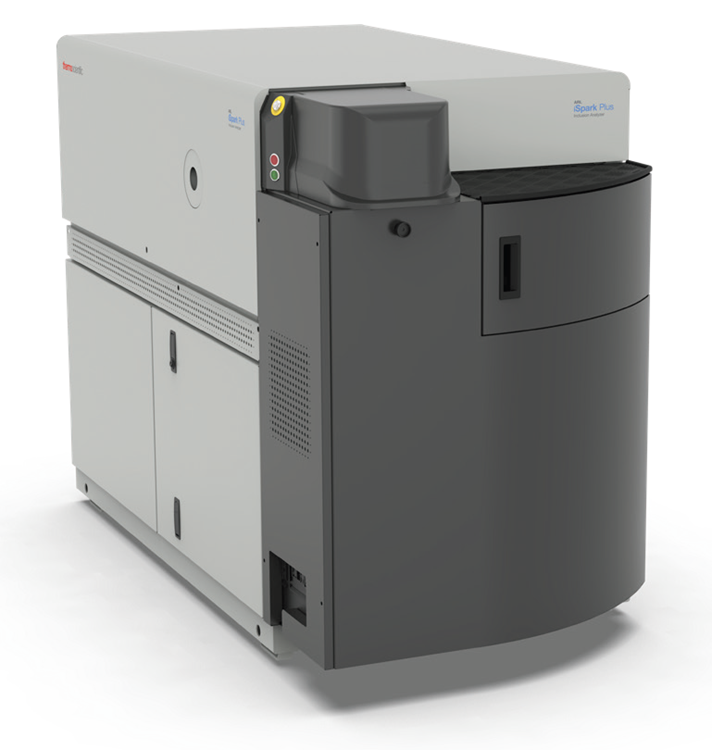
Image Credit: Thermo Fisher Scientific – Handheld Elemental & Radiation Detection
Spectrometer Design and Key Technologies
Paschen-Runge Optical System and PMT Detection
The ARL iSpark 8860 Plus is based on Thermo Scientific's most reliable one-meter focal length, vacuum-purged PMT spectrometer with Paschen-Runge mounting. The spectrometer delivers exceptional resolution and stability, yielding outstanding performance across all elements.
The instrument also has novel features and technology, such as:
- Improved signal capture and processing for better performance and accuracy
- The Thermo Scientific™ intelliSource™ is a digital spark source that offers enhanced flexibility and efficiency
- The analytical stand reduces maintenance and argon use
- ECO modes save argon while idling
- Thermo Scientific’s maintenance management software optimizes instrument performance and reliability with minimal maintenance
IntelliSource Digital Spark Source
The IntelliSource is an innovative spark source for OES. This double current-controlled source (CCS) is more versatile than other digital sources, enabling Thermo Scientific’s application specialists to create effective spark current shapes for sample surface preparation, material ablation, and light emission in each metal matrix.
An optimized pre-integration spark current shape reduces the effects of both the matrix and the metallurgical structure by optimally remelting and homogenizing the sample prior to signal integration. The perfectly adjusted integration spark current shapes provide optimal performance on elements in trace amounts or at high alloying concentrations.
Single Spark Acquisition and Processing (SSA, DISIRE, FAST)
The analysis is carried out by repeating very short ‘single sparks’ at high frequency. PMTs gather and digitize the signals released during each single spark, known as ‘single spark signals’. Special signal treatments can then be given to the single spark signals to enhance the benefits of the ARL iSpark Plus:
- DISIRE (DIffuse Spark Intensity REmoval) and FAST (Flexible Acquisition STart/Stop) to maximize accuracy and performance
- Spark-DAT algorithms to analyze micro-inclusions
Time Gated Acquisition (TGA)
TGA is an upgraded variant of TRS (Time Resolved Spectroscopy). Signal capture occurs within specific TGA windows, short time intervals within individual flashes.
The window’s start time and duration are tuned for each analytical line to enhance the signal of interest while minimizing noise and the collected interferences. This leads to improved detection limits, precision, and accuracy across all elements.
Sample Preparation and Analysis Time
Sample Preparation
The sample surface is typically prepared with a lathe or milling machine. Grinding is not feasible due to the possibility of contamination.
Analysis Time
On average, an analytic run takes less than 23 seconds from start to result display.
Analytical Performance
Detection Limits and Precision
Thermo Scientific guarantees the precision values and detection limits (DL) of the ARL iSpark 8860 Plus as shown in Table 1.
‘Precision’ expresses the closeness of concentration values between individual runs of an analysis. The lower the precision, the fewer analysis runs are required to achieve confidence in the results.
The DL is the minimum concentration that may be identified from a blank value with a certain probability. It is defined as three times the background standard deviation, expressed in concentration units.
Limit of Quantification (LOQ)
For quantitative analysis, consider the limit of quantification (LOQ ≈ 3·DL). The limit of quantification is the minimum concentration that can be determined quantitatively. When low-concentration calibration standards are available, the LOQ is the minimum value in the calibration menus.
Accuracy and Calibration Approach
Accuracy is the most significant feature of an OES spectrometer, representing the correlation between the analytical result and the reference value.
It is determined by the quality of the calibration reference materials and their certificates, in addition to some instrumental attributes and parameters (for example, optical resolution, spark source condition, or TGA window), and the mathematical model used to compute the calibration curves.
Calibration and Measurement Uncertainty
Factory Calibration Using CRMs
Each ARL iSpark 8860 Plus Metal Analyzer is individually-calibrated in Thermo Fisher Scientific’s factory. Calibrations are carried out with CRMs or reference materials that have been extensively evaluated and accepted.
Multivariable Regression (MVR) Modeling
The calibration curves are set using a strong multivariable regression (MVR) software tool that corrects for matrix effects and spectral interferences to help ensure the highest possible accuracy.
Measurement Uncertainty Reporting
Thermo Scientific™ OXSAS Analytical Software offers on-site calibration using the same MVR model. The measurement uncertainty based on the calibration curve and precision value can be displayed for each sample. A dedicated product specification (PS41282) is available.
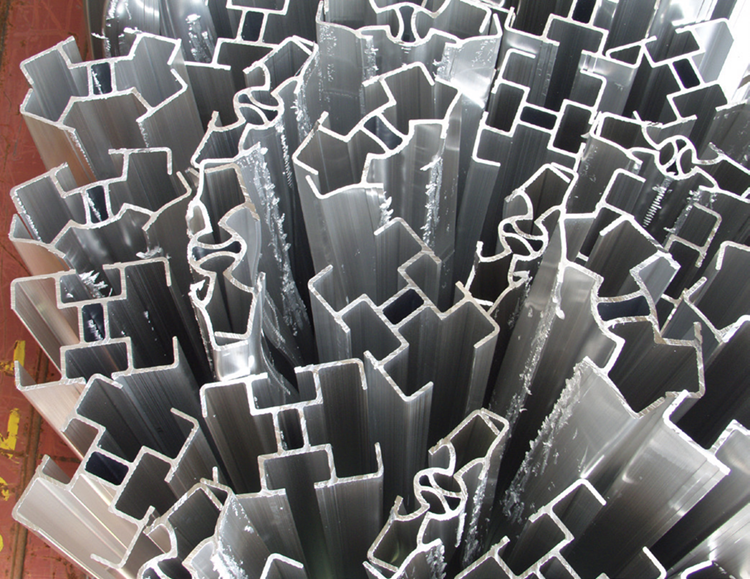
Image Credit: Thermo Fisher Scientific – Handheld Elemental & Radiation Detection
Elemental Analysis Performance Data
Detection Limits and Precision Values for Pure and Ultra-Pure Aluminum
Table 1. ARL iSpark 8860 Plus - Detection limits and precision values for pure and ultra-pure aluminum. Source: Thermo Fisher Scientific – Handheld Elemental & Radiation Detection
| ELEMENT [in ppm] |
Ag |
As |
B |
Ba |
Be |
Bi |
Ca |
Cd |
Ce |
Co |
Cr |
Cu |
Fe |
Ga |
Hg |
In |
La |
| Typical DL Pure Al |
0.006 |
1.8 |
0.1 |
0.015 |
0.0006 |
0.5 |
0.07 |
0.2 |
1.3 |
0.07 |
0.08 |
0.02 |
0.4 |
0.05 |
0.25 |
0.15 |
0.6 |
| Guaranteed DL Pure Al |
0.01 |
2.5 |
0.15 |
|
0.001 |
0.6 |
0.1 |
0.25 |
1.5 |
0.1 |
0.1 |
0.05 |
0.5 |
0.08 |
0.3 |
0.2 |
0.8 |
| Typical DL Ultra Pure Al |
0.005 |
1.7 |
0.1 |
0.01 |
0.0006 |
0.4 |
0.07 |
0.15 |
1.2 |
0.04 |
0.05 |
0.015 |
0.3 |
0.04 |
0.25 |
0.1 |
0.4 |
| Guaranteed DL Ultra Pure Al |
0.007 |
2.5 |
0.15 |
|
0.001 |
0.5 |
0.1 |
0.2 |
1.3 |
0.05 |
0.08 |
0.02 |
0.4 |
0.05 |
0.3 |
0.15 |
0.5 |
| Level [ppm] |
Precision (same unit as concentration level) |
| 0.2 |
0.005 |
|
|
|
0.004 |
|
|
|
|
|
0.015 |
0.0043 |
|
|
|
|
|
| 0.5 |
0.01 |
|
0.045 |
|
0.008 |
|
0.03 |
0.03 |
|
0.015 |
0.02 |
0.0084 |
|
|
|
0.03 |
|
| 1 |
0.015 |
|
0.065 |
|
0.012 |
|
0.04 |
0.04 |
|
0.025 |
0.035 |
0.015 |
0.055 |
0.03 |
0.075 |
0.045 |
|
| 2 |
0.025 |
|
0.09 |
|
0.02 |
0.1 |
0.07 |
0.06 |
|
0.04 |
0.05 |
0.025 |
0.085 |
0.05 |
0.1 |
0.055 |
0.2 |
| 5 |
0.05 |
0.45 |
0.15 |
|
0.04 |
0.13 |
0.1 |
0.1 |
0.15 |
0.07 |
0.09 |
0.045 |
0.15 |
0.09 |
0.15 |
0.073 |
0.3 |
| 10 |
0.09 |
0.6 |
0.2 |
|
0.06 |
0.15 |
0.15 |
0.15 |
0.2 |
0.1 |
0.13 |
0.075 |
0.22 |
0.14 |
0.25 |
0.1 |
0.4 |
| 20 |
0.15 |
0.8 |
0.3 |
|
0.1 |
0.2 |
0.3 |
0.2 |
0.3 |
0.15 |
0.2 |
0.12 |
0.35 |
0.23 |
0.3 |
0.12 |
0.5 |
| 50 |
0.25 |
1.3 |
0.5 |
|
|
0.4 |
0.5 |
0.35 |
0.4 |
0.3 |
0.4 |
0.25 |
0.6 |
0.45 |
0.45 |
0.5 |
0.7 |
| 100 |
0.45 |
1.8 |
0.7 |
|
|
0.8 |
0.7 |
0.55 |
0.55 |
0.5 |
0.6 |
0.4 |
0.9 |
0.7 |
0.65 |
0.7 |
0.9 |
| 200 |
0.7 |
|
1 |
|
|
1.5 |
|
0.8 |
0.75 |
0.8 |
0.9 |
0.65 |
1.4 |
1.1 |
1 |
1.5 |
|
| 500 |
|
|
|
|
|
|
|
|
|
|
1.5 |
1.2 |
3 |
2.2 |
|
|
|
| 1000 |
|
|
|
|
|
|
|
|
|
|
|
|
5 |
|
|
|
|
| 2000 |
|
|
|
|
|
|
|
|
|
|
|
|
10 |
|
|
|
|
| ELEMENT [in ppm] |
Li |
Mg |
Mn |
Mo |
Na |
Ni |
P |
Pb |
Sb |
Si |
Sn |
Sr |
Ti |
Tl |
V |
Zn |
Zr |
| Typical DL Pure Al |
0.004 |
0.02 |
0.1 |
0.05 |
0.04 |
0.08 |
1.6 |
0.2 |
0.75 |
0.08 |
0.3 |
0.015 |
0.08 |
0.1 |
0.1 |
0.6 |
0.07 |
| Guaranteed DL Pure Al |
0.008 |
0.03 |
0.2 |
0.1 |
0.1 |
0.15 |
2 |
0.25 |
1 |
0.1 |
0.4 |
0.02 |
0.1 |
|
0.15 |
0.8 |
0.1 |
| Typical DL Ultra Pure Al |
0.001 |
0.007 |
0.07 |
0.02 |
0.03 |
0.07 |
1.6 |
0.17 |
0.6 |
0.05 |
0.2 |
0.01 |
0.06 |
0.08 |
0.08 |
0.5 |
0.03 |
| Guaranteed DL Ultra Pure Al |
0.004 |
0.01 |
0.1 |
0.05 |
0.06 |
0.1 |
2 |
0.2 |
1 |
0.08 |
0.3 |
0.015 |
0.08 |
|
0.1 |
0.6 |
0.05 |
| Level [ppm] |
Precision (same unit as concentration level) |
| 0.2 |
0.005 |
0.003 |
|
|
0.01 |
|
|
|
|
|
|
|
|
0.012 |
|
|
|
| 0.5 |
0.01 |
0.0068 |
0.032 |
|
0.02 |
0.015 |
|
0.035 |
|
0.02 |
|
|
0.025 |
0.02 |
0.03 |
|
0.025 |
| 1 |
0.02 |
0.012 |
0.047 |
0.015 |
0.04 |
0.025 |
|
0.05 |
|
0.025 |
|
0.025 |
0.035 |
0.035 |
0.04 |
|
0.033 |
| 2 |
0.03 |
0.022 |
0.067 |
0.02 |
0.06 |
0.04 |
|
0.07 |
0.15 |
0.035 |
0.07 |
0.04 |
0.05 |
0.05 |
0.07 |
0.15 |
0.05 |
| 5 |
0.07 |
0.05 |
0.11 |
0.04 |
0.12 |
0.07 |
0.35 |
0.12 |
0.23 |
0.06 |
0.11 |
0.08 |
0.1 |
0.09 |
0.12 |
0.25 |
0.09 |
| 10 |
0.2 |
0.09 |
0.16 |
0.07 |
0.2 |
0.1 |
0.45 |
0.17 |
0.3 |
0.085 |
0.15 |
0.15 |
0.15 |
0.13 |
0.2 |
0.3 |
0.13 |
| 20 |
0.3 |
0.15 |
0.22 |
0.1 |
0.35 |
0.15 |
0.5 |
0.25 |
0.45 |
0.12 |
0.2 |
0.25 |
0.2 |
0.2 |
0.3 |
0.4 |
0.2 |
| 50 |
0.55 |
0.35 |
0.36 |
0.2 |
0.65 |
0.3 |
0.6 |
0.45 |
0.6 |
0.2 |
0.3 |
0.5 |
0.4 |
0.35 |
0.6 |
0.6 |
0.35 |
| 100 |
0.85 |
0.6 |
0.52 |
|
|
0.45 |
1 |
0.9 |
1 |
0.3 |
0.45 |
0.85 |
0.6 |
|
0.9 |
0.8 |
0.55 |
| 200 |
|
1.1 |
0.75 |
|
|
0.7 |
|
1.5 |
2 |
0.75 |
0.6 |
1.4 |
0.9 |
|
1.4 |
2 |
1 |
| 500 |
|
2.4 |
1.2 |
|
|
1.3 |
|
3 |
4.5 |
1.6 |
|
|
1.6 |
|
2.6 |
5 |
2 |
| 1000 |
|
|
|
|
|
|
|
|
|
2.7 |
|
|
|
|
|
15 |
|
Method Conditions and Performance Considerations
- DLs and precision figures are based on at least six repeat measurements.
- The guaranteed DLs are determined with a 95 % confidence limit.
- Precision values are normal. The guaranteed precision levels are 1.5 times higher.
- Guaranteed precision values apply to the specific concentrations covered by Thermo Scientific’s standard calibrations. Precision figures for concentrations not covered by the standard calibrations are provided solely for information purposes.
- The values are accurate for an ARL iSpark configured as recommended. The performance of multi-matrix instruments varies depending on the analytical lines and grating.
- These values relate to samples created using the suggested procedure and with homogeneous element distributions. Homogeneity is determined by the sample's metallurgical structure, which is affected by its composition and production process.
Other factors that influence the liquid melt include the quality of the sampling and any mechanical deformation caused by rolling. A measured precision greater than the guaranteed precision implies that the element is segregated or has an inhomogeneous distribution with a 95 % confidence level.
- Values are acquired with Ar 48 of 99.998 % purity or higher.
Available Calibrations for Aluminum
Pure and Ultra-Pure Aluminum Calibrations
The following calibrations are available:
- Ultra-pure aluminum
- Pure aluminum
The following calibrations are also available for the examination of aluminum alloys: low alloy Al, AlSi, AlSiCu, AlCu, AlZn, AlMg, and global Al. There is a special application note (AN41247) for these alloyed properties.
Aluminum Alloy Calibration Options
The calibrations are given as turnkey, fully parameterized applications. Setting-up samples (SUS) are given with the instrument to ensure calibration accuracy. Local Thermo Fisher Scientific offices can deliver further information about the calibrations.
Inclusion Analysis Capability
Spark-DAT-Based Inclusion Detection
The Standard Inclusion Analysis option is offered for assessing nonmetallic micro-inclusions in pure and ultra-pure aluminum.
Combined Elemental and Inclusion Analysis
The inclusion data is acquired by processing the signal spark signals using Spark-DAT (Spark Data Acquisition and Treatment) methods. Inclusion analysis can be performed independently or in conjunction with elemental analysis.
Instrument Stability and Memory Effects
Stability and Drift Behavior
The equipment’s stability is critical when performing routine analysis. High stability lowers the need for maintenance and drift corrective activities. The standard deviation of mid-term stability is usually less than three times the short-term precision value at the observed concentration.
Memory Effects and Conditioning
The memory effect is caused by the contamination of the analytical stand following the analysis of samples that contain components in relatively high concentrations. Some components in the subsequent samples may be measured at artificially high concentrations.
Depending on the concentration of the alloying materials, five to six conditioning runs may be required to eradicate contamination.
When the equipment is also used for the study of aluminum alloys, the memory effect may be more evident. Using different sets of analytical tables, electrodes, and insulators for pure and ultra-pure aluminum is recommended.
Conclusion
The ARL iSpark 8860 Plus Metal Analyzer not only offers cutting-edge technology, but it also includes all of the system features required to address the vital needs of the metal markets.
- Exceptional hardware stability and reliability
- High performance in detection limits, precision, and accuracy with minimal analysis time
- Individual true calibration
- Advanced software technology
- User-friendly operation
- Widest range of metals analysis
- Analysis of non-metallic micro-inclusions
- Automation solutions with ARL SMS products
- Advanced technical/service support
All these capabilities allow productivity optimization and short payback times:
- Investment costs are minimized by:
- Exceptional instrument lifetime and continuous possibilities for upgrade (software and hardware)
- Instrument capability to cover future needs
- Production costs are reduced by:
- More accurate and reproducible analyses in the shortest possible time
- Increased instrument availability, thanks to high stability and low frequency of drift correction
- Operating and maintenance costs are reduced by:
- Lessened consumption of drift correction samples and simple maintenance
- Substantial argon savings during and between analyses
- Overall cost management is reduced by:
- Optimal use of materials
- Extremely low running costs compared to other methods

This information has been sourced, reviewed, and adapted from materials provided by Thermo Fisher Scientific – Handheld Elemental & Radiation Detection.
For more information on this source, please visit Thermo Fisher Scientific – Handheld Elemental & Radiation Detection.