ABB offers natural gas quality monitoring with fast, accurate, and reliable measurement of H2S, H2O, CO2, and O2 using Off-Axis Integrated Cavity Output Spectroscopy (OA-ICOS).
ABB's Sensi+ NG is a compact natural gas contaminant analyzer that employs a novel tunable diode laser (TDLAS) technique known as Off-Axis Integrated Cavity Output Spectroscopy.
The device analyzes corrosive compounds such as hydrogen sulfide, carbon dioxide, water, and oxygen in real time from complex, time-varying natural gas streams.
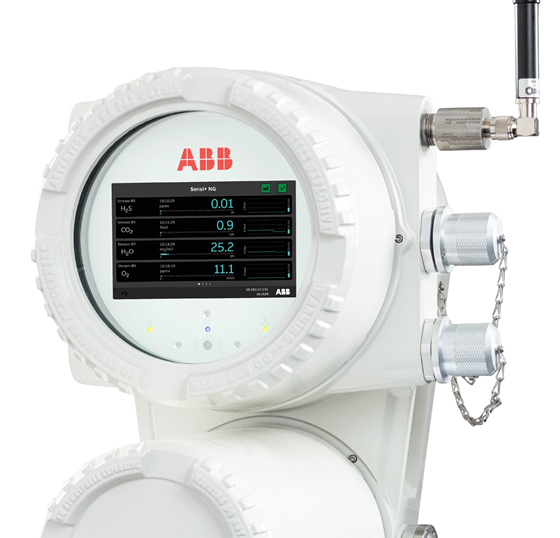
Image Credit: ABB Measurement and Analytics Analytical Products
While many installations must detect oxygen disruptions beyond 1000 ppm, others have far lower limits. Sensi+ NG is uniquely capable of sensitive measurements in both ranges: single-digit ppm and greater concentrations.
This unique capability stems from the fact that OA-ICOS is a cavity-enhanced absorption spectroscopy (CEAS) technique. It uses laser light, which is reflected back and forth between highly reflective mirrors and absorbed by contaminated gases over a kilometers-long effective path length within a physically small gas cell.
For a given amount of contaminated gas, the absorption strength scales with the effective path length, which is determined by the mirror reflectivity and the gas's light absorption. As the concentration of a contaminant in the stream increases, it absorbs more light, shortening the effective path length.
This link between the amount of contaminant, the effective path length, and the absorption strength implies that the measured range is dynamic, resulting in a significantly broader range than is feasible with typical TDLAS analyzers with fixed path lengths.
As a result, Sensi+ NG can perform high-dynamic-range measurements while maintaining low-end performance.
Sensi+ NG demonstrated its wide dynamic range by measuring natural gas mixtures containing up to 4800 ppm oxygen with substantial step changes, as well as mixtures with less than 20 ppm oxygen with step-change magnitudes near the indicated detection limit.
To generate the mixes, oxygen and methane were blended at different ratios using mass-flow controllers that varied the relative flow rates of each gas. The Sensi+ NG analyzer sampled the resulting mixture and compared it to the set point. For the upper range, 4800 ppm oxygen was diluted with methane.
The set point was initially reduced from 4000 ppm to 0 in 400 ppm increments every 7 minutes, then increased using the same procedures. The set point then cycled between 800 and 4000 ppm five times.
Finally, each condition was assessed for 15 minutes. Sensi+ NG responded rapidly and precisely to each set-point step adjustment. Over this range, the measurement's precision was substantially smaller than the step-change magnitude shown in Figure 1.
Figure 2 compares the average measured value of each step to the set point, demonstrating that the measurement is linear and accurate within 2% of the set point over this wide range.
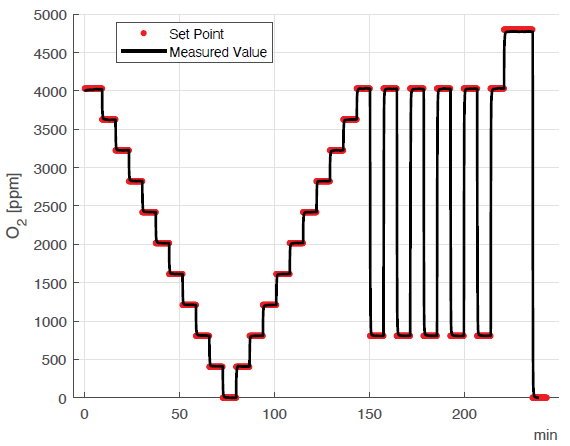
Figure 1. Measured oxygen in natural gas at discrete set points between 0 and 4800 ppm, where the oxygen set point was defined by the flow rates of the mass flow controllers. Image Credit: ABB Measurement and Analytics Analytical Products
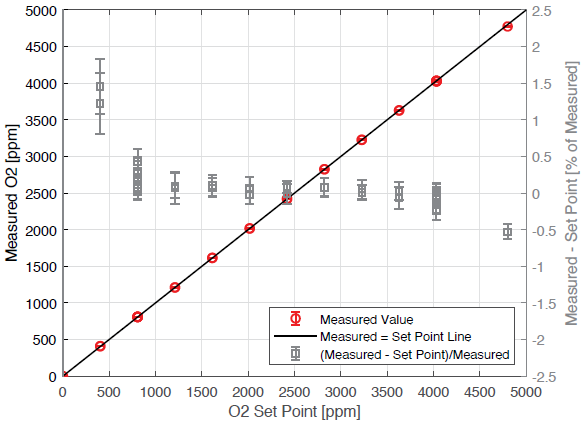
Figure 2. Comparison of the average oxygen concentration measured at each step to the set point. The right axis shows the same data plotted as the percent difference between the measured values and the set points. Image Credit: ABB Measurement and Analytics Analytical Products
In the low range, 200 ppm oxygen was diluted with methane. In this test, the set point was adjusted from 0 to 20 ppm with step adjustments ranging from 2 ppm to 20 ppm, both increasing and decreasing.
In this example, the step changes were within an order of magnitude of the instrument's repeatability, as shown in Figure 3, where random variations within a step are clearly discernible in contrast to the larger range of Figure 1.
This demonstrates typical measurements approaching the limit of detection, in which Sensi+ NG responds promptly and correctly to each set-point step change. During the zero phase, the mass flow controller for the oxygen source was closed.
When it opened for the next step, oxygen levels first increased before stabilizing at the right level based on the flow rates. The Sensi+NG sensor detected this disturbance rapidly and traced its stabilization to the fixed-point value.
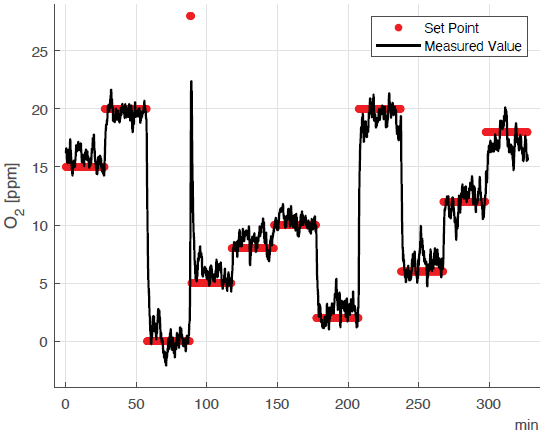
Figure 3. Measured oxygen in natural gas at discrete set points near the limit of detection between 0 and 20 ppm, where the oxygen set point was defined by the flow rates of the mass flow controllers. The spike after the 0 ppm step reflects a transient increase that occurred after opening the mass flow controller for the gas containing oxygen. Image Credit: ABB Measurement and Analytics Analytical Products
Figure 4 shows the average measured value of each step relative to the set point, proving that the measurement stays linear and accurate in this low range.
To show the differences in range-appropriate units, the right axis of the high-range dataset in Figure 2 displays the difference as a percentage of the measurement, whereas the right axis of the low-range dataset in Figure 4 displays the difference as an absolute value in ppm.
These findings demonstrate that, despite some uncertainty in this range because of measurement repeatability, single-digit ppm oxygen steps may still be readily discriminated.
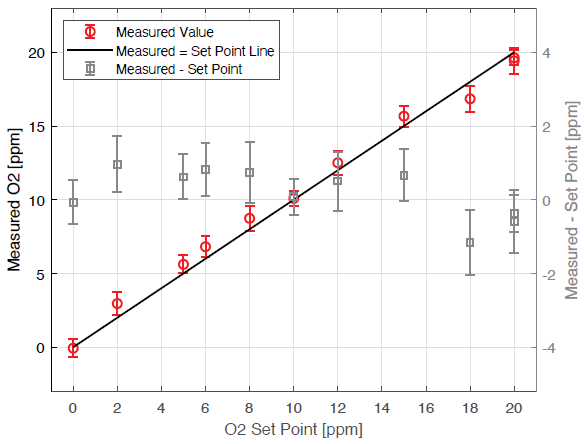
Figure 4. Comparison of the average oxygen concentration measured at each step to the set point. The right axis shows the same data plotted as the absolute difference between the measured values and the set points. Image Credit: ABB Measurement and Analytics Analytical Products
Sensi+ NG provides accurate oxygen measurements across the entire pollutant detection spectrum, from trace ppm to high concentrations, ensuring operations remain compliant and responsive to changing specifications.
Sensi+ NG's capacity to monitor levels and detect disruptions in real time ensures reliable performance as industry standards tighten.

This information has been sourced, reviewed and adapted from materials provided by ABB Measurement and Analytics Analytical Products.
For more information on this source, please visit ABB Measurement and Analytics Analytical Products.