Microplastics have attracted growing attention in both scientific and political discourses, and are widely recognized as a major concern in environmental and public health. The number of scientific publications addressing microplastics has increased rapidly alongside a corresponding increase in funding to understand their effects on human health and ecosystems worldwide.
What Submicron IR, Optical Photothermal Infrared (O-PTIR) Offers
- Broad particle size coverage: O-PTIR can offer automated, precise infrared (IR) characterization of microplastics from the hundreds of nanometres range to particles mm’s in size.
- Reliable spectral identification: O-PTIR provides IR spectra, collected in reflection mode, delivering FTIR transmission/ATR-like spectra, with minimal artifacts, allowing direct comparison with established Fourier-transform infrared (FTIR) spectroscopy databases
- Automated analysis: Automated measurements and chemical identification can be performed with FeaturefindIR and Micro-ChemID
- Complementary analytical performance: O-PTIR addresses several limitations associated with Raman spectroscopy while delivering complementary and confirmatory results
- Simultaneous IR and Raman acquisition: Both O-PTIR and Raman spectra of microplastic particles can be collected from the same location at the same time
- Improved particle selection: Combining fluorescence microscopy with O-PTIR allows users to locate and identify fluorescently tagged polymeric particles specifically with increased speed and increased sample throughput. Often, most particles from an environmental sample are not microplastics, with the microplastics fraction often between 1-10%, meaning that 90-99% particles measured are not the target microplastics, resulting a in a significant waste of time. Fluorescently labelling the particles with a dye that attached to polymers, is an ideal way to improve measurement efficiency. And because the O-PTIR measurement is conducted on the same microscope and even the same objective as the fluorescence imaging objective, there are not sample transfer or image-spectra registration issues.
The Importance of Particle Size
Smaller microplastics and nanoplastics are of particular biological concern because of their greater potential to cross biological barriers, although their effects depend on exposure and particle characteristics.
Growing concern has prompted drinking-water monitoring initiatives. California’s Senate Bill 1422 (2018) led to testing requirements initially covering particles down to 20–50 µm, depending on the analytical method, with a second phase targeting 5 µm, subject to laboratory accreditation. Under its Drinking Water Directive, the EU has adopted a standardized measurement methodology covering particles from 20 µm. These analytical cutoffs are not health-based thresholds, highlighting the need for reliable testing across a wider size range, including smaller particles.
Chemical and morphological analysis of microplastic particles serves three key purposes:
- Understanding where microplastics originate to reduce their release
- Assessing the potential dangers microplastics pose to protect the environment and human health
- Removing microplastic particles from the environment
Recent studies indicate microplastic particle size is an important consideration when assessing their potential biological effects.1–4 As the size range with the greatest potential to cause biological harm is those under 20 µm, achieving reliable chemical identification in this size range is crucial.
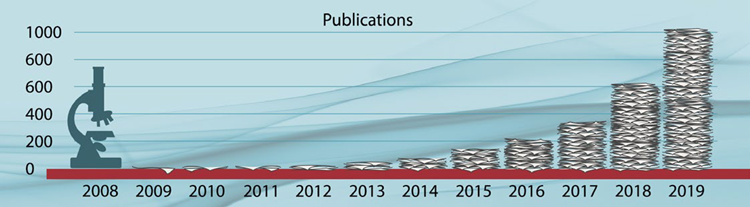
Microplastics scientific publications/year. Image Credit: Qin, F., et al. (2020)1
Analytical Techniques for Microplastics
The most common chemical analysis techniques used for identifying microplastics include conventional FTIR and Raman spectroscopy. However, these techniques have several limitations: insufficient spatial resolution, measurement accuracy, and throughput; the risk of photodamage to samples; fluorescence interference; and more. All of these limit the widespread use of these techniques for particles under 20 µm in size.
O-PTIR spectroscopy is an emerging super-resolution technique that provides chemical analysis via IR spectroscopy. It has a spatial resolution well below 1 µm, which is approximately20–30× better than conventional FTIR microspectroscopy.
The technique also does not suffer from the spectral artifacts caused by particle morphology that direct IR techniques like FTIR and emerging IR laser (Quantum Cased Laser, QCL) based techniques like LDIR can suffer from. In addition, O-PTIR can avoid several common difficulties encountered in Raman analysis, including low sensitivity, fluorescence interference, and photodamage.
Conventional IR microscopy is constrained by the diffraction limit, which restricts the spatial resolution achievable using traditional IR techniques. O-PTIR addresses this limitation by illuminating the sample with a mid-IR pulsed tunable laser and detecting the IR absorption with a second visible laser probe beam operating at 532 nanometers (nm).
When the mid-IR laser is tuned to a wavelength that excites molecular vibrations in the sample, absorption of IR energy occurs. This creates photothermal effects, such as sample surface expansion and a change in refractive index.
The visible probe laser, typically focused to approximately 0.5 µm spot size, detects these photothermal responses via a modulation induced in the scattered visible light. This can be seen in Figure 1. The IR laser can be swept through the wavenumber range in two seconds or less to obtain an IR spectrum.
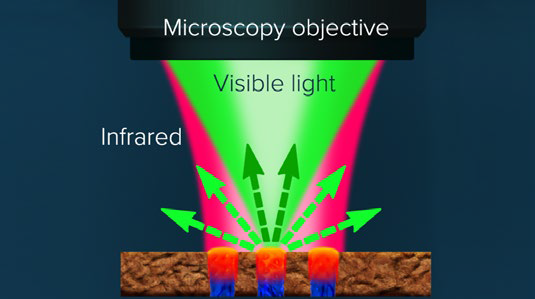
Figure 1. A pulsed tunable, IR source is focused on sample. Absorbed IR light causes the sample to heat up, creating a photothermal response. The visible probe laser centered in the diameter of the IR illuminated area detects the photothermal response from the sample upon IR absorption. Image Credit: Photothermal Spectroscopy Corp
Comparing O-PTIR and FTIR
To evaluate the agreement between O-PTIR and conventional FTIR, Böke et al. conducted a comprehensive evaluation of a broad selection of plastic materials.5
Their results demonstrated very good agreement with the FTIR spectra types. This can be seen in Figure 2, while further experimental details can be viewed in the publication.
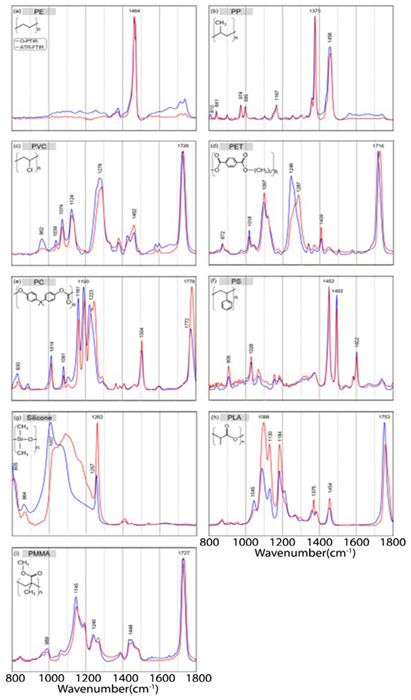
Figure 2. Normalized IR spectra from 1800 to 800 cm−1 of different plastics: a) polyethylene (PE), b) polypropylene (PP), c) polyvinyl chloride (PVC), d) polyethylene terephthalate (PET), e) polycarbonate (PC), f) polystyrene (PS), g) silicone, h) polylactide acid (PLA), i) and polymethylmethacrylate (PMMA), collected with standalone FTIR system (blue) and the O-PTIR instrument collected in refection mode (red). Image Credit: Photothermal Spectroscopy Corp
O-PTIR Spectroscopy of Submicron Plastics
O-PTIR's ability to characterize plastics at submicron dimensions was demonstrated using a range of polymer beads analyzed with the mIRage system.
Figure 3 shows an optical image and corresponding IR spectra of polystyrene (PS) plastic beads that ranged from 500 nm to over 4 µm in diameter.
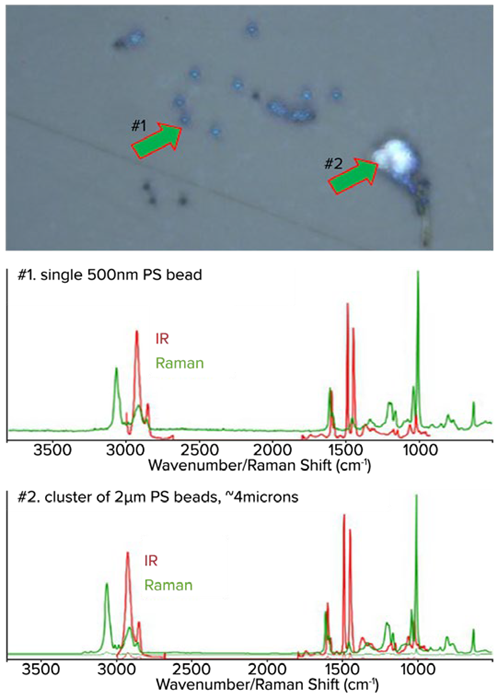
Figure 3. Top: Optical image of various sizes of small PS beads. Middle: The corresponding O-PTIR spectra from a 500 nm PS bead. Bottom: Spectra from a 2 µm cluster of beads of approximately 4 µm in size. The IR spectra from single 500 nm bead or a cluster of 2 µm beads all look the same. The spectra are raw and unfiltered. Image Credit: Photothermal Spectroscopy Corp
Submicron IR Shape- and Size-Independent Spectra
A further experiment investigated the ability of O-PTIR to characterize particles of various shapes and sizes while collecting artifact-free data in the presence of strongly scattering salt crystals.
A mixed-model sample was used, which consisted of PS beads measuring 900 nm, 2 µm, 4.5 µm, and 10 µm, with polymethyl methacrylate (PMMA).
With an FTIR/quantum cascade laser (QCL) system, particles of these dimensions may be too small to measure. Plus, the range of particle sizes together with the salt crystals would generate dispersive scatter artifacts. These effects can significantly alter spectra and reduce confidence in chemical identification.
To examine O-PTIR performance under these conditions further, the mixed polymer bead samples were suspended in salt water and deposited onto a CaF2 substrate. This was so that the polymer beads would be interspersed with salt crystals, as shown in Figure 4.
Despite the variation in bead dimensions, the spectra in Figure 4 were consistent with their polymer type. For instance, there were no dispersive scatter artifacts present. These findings show that O-PTIR can support correct identification regardless of a particle’s shape and size.
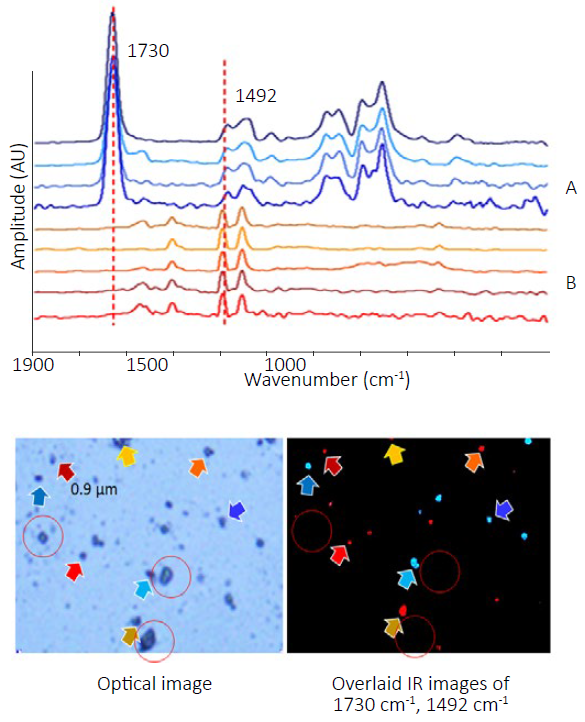
Figure 4. Top: Spectra of PS and PMMA beads ranging in size from 0.9 µm to 10 µm. Bottom left: Corresponding optical image. Bottom right: Overlaid chemical image collected at 1492 cm-1 and 1730 cm-1 highlights both materials. Colors of the arrows correspond to the colors of the spectra. Salt crystals are highlighted in red circles. Note how no O-PTIR signal is observed in the IR image from the salt crystals. Image Credit: Photothermal Spectroscopy Corp
O-PTIR Single-Frequency Imaging
Single-frequency imaging can accelerate particle identification, especially if key absorbing spectral features are known and can be distinguished from other components.
In the example shown in Figure 4, imaging was performed using the main bands of PS (1492 cm-1) and PMMA (1730 cm-1).
A unique advantage of O-PTIR is that the measured spectral response is only associated with sample absorbance. Particles that scatter light but do not confound the image do not necessarily generate a corresponding signal in the chemical image.
This can be seen in Figure 4, where the location of the salt crystals is circled. Although these crystals are clearly visible in the optical image and could be mistaken for polymer beads, they produce no corresponding response in the selected single-frequency images.
Conventional FTIR and direct QCL microscope methods can be more susceptible to scattering effects under comparable conditions. Nearby salt crystals can severely distort the chemical images with these techniques, and can be identified by the scattering artifacts in the particles’ spectra close to the salt crystals.
Artifact-Free IR Spectroscopy of Large and Colored Microplastics
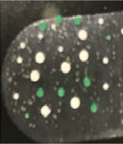
Figure 5 presents O-PTIR measurements from larger microplastic particles with different dimensions and colors, demonstrating the technique’s ability to measure from the submicron range to particles 1 mm in size.
Despite the particles’ size, the spectra are artifact-free with none of the band saturation effects that traditional FTIR techniques would produce.
 |
|
Particle Type |
Type 1 |
Type 2 |
Type 3 |
| Morphology |
sphere |
sphere |
sphere |
| Color |
white |
white |
green |
| Size range |
370–450 μm dia |
770–920 μm dia |
320–680 μmdia |
| Count |
10 |
seven |
nine |
| Material |
polyethylene |
polyethylene |
polyethylene |
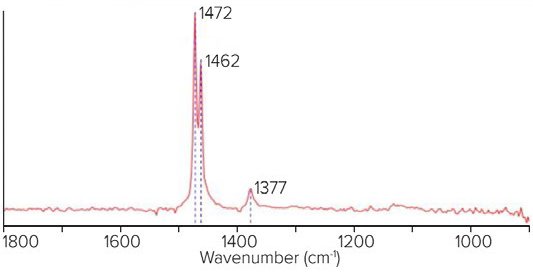
Figure 5. Top left: Optical image shows location and color of the microplastics. Top right: Table shows the types of microplastics. Bottom: Spectra demonstrate artifact-free measurements of the larger microplastic samples. Image Credit: Photothermal Spectroscopy Corp
Microplastics Characterization with Simultaneous IR and Raman and Dual IR/Raman Database Searching
In addition to the O-PTIR measurements, the visible probe beam can produce Raman-scattered light from the measurement area. Collecting this scattered light enables simultaneous acquisition of both IR and Raman spectra.
Both datasets are obtained at the same locations, at the same time, and with the same submicron spatial resolution. A schematic diagram of this optical beam path is shown in Figure 6.
Integrating the two techniques into a single system provides a powerful combination for a broader range of microplastic measurements, offering complementary and confirmatory spectral information and more accurate identification, while also improving analytical productivity.
References and Further Reading
- Qin, F., et al. (2020). Bibliometric Profile of Global Microplastics Research from 2004 to 2019. International Journal of Environmental Research and Public Health, 17(16), p.5639. DOI:10.3390/ijerph17165639. https://www.mdpi.com/1660-4601/17/16/5639.
- Hale, R.C., et al. (2020). A global perspective on microplastics. Journal of Geophysical Research: Oceans, 125(1). DOI:10.1029/2018jc014719. https://agupubs.onlinelibrary.wiley.com/doi/10.1029/2018JC014719.
- Wong, C. and Coffin, S. (2021). Standard operating procedures for extraction and measurement by infrared spectroscopy of microplastic particles in drinking water. Available at: https://www.waterboards.ca.gov/drinking_water/certlic/drinkingwater/documents/microplastics/mcrplstcs_ir.pdf.
- Wong, C. and Coffin, S. (2022). SWB-MP2-rev1 standard operating procedures for extraction and measurement by Raman spectroscopy of microplastic particles in drinking water. Available at: https://www.waterboards.ca.gov/drinking_water/certlic/drinkingwater/documents/microplastics/swb-mp2-rev1.pdf.
-
Böke, J.S., et al. (2022). Optical photothermal infrared spectroscopy with simultaneously acquired Raman spectroscopy for two-dimensional microplastic identification. Scientific Reports, 12(1). DOI:10.1038/s41598-022-23318-2. https://www.nature.com/articles/s41598-022-23318-2.

This information has been sourced, reviewed, and adapted from materials provided by Photothermal Spectroscopy Corp.
For more information on this source, please visit Photothermal Spectroscopy Corp.