Sponsored by MicrotracReviewed by Louis CastelNov 20 2026
A formulation may look uniform to the eye even as its internal structure begins to change. Particles can settle, droplets can migrate upward, or individual dispersed particles may combine into larger clusters. These changes are often noticed only once they create a visible gradient, layer, or other obvious alteration. By then, a storage study may already have taken days or months, and an unstable formulation may have wasted considerable development time.
Image Credit: fotaro100/Shutterstock.com
The TURBISCAN Stability Analyzer targets this period of limited visibility, reducing the time required to identify instability by as much as three orders of magnitude relative to visual observation.1 Through static multiple light scattering (SMLS), the instrument measures shifts in particle or droplet size and concentration across an undiluted sample. This lets formulators detect early instability, rank alternatives, and adjust formulation or processing variables before visible failure occurs.
Why Visual Stability Can Be Misleading
Sedimentation and creaming are both migration processes. During sedimentation, dispersed particles travel downward, while creaming causes lower-density droplets or particles to rise. Flocculation describes the clustering of dispersed units, whereas coalescence occurs when droplets combine and their separate interfaces disappear.2 These mechanisms may occur simultaneously and can eventually lead to clarification or full phase separation.
Visible separation, however, is a delayed and comparatively insensitive sign of instability. Small concentration gradients or early growth in aggregate size may have little effect on how a product looks. Visual assessment can also vary with the observer, lighting conditions, and the criteria applied. Although it may show that a sample has failed, it offers little quantitative detail about when instability started, how rapidly it is advancing, or which mechanism dominates.
This becomes especially problematic when traditional testing requires storing multiple formulations and inspecting them at intervals. An unstable candidate may remain in the development program until a visible boundary appears, postponing the next round of optimization.
Detecting Change Across the Entire Sample
TURBISCAN measurements are made directly on a dispersion held in a cylindrical vial. An optical head moves vertically through the sample using a near-infrared source, capturing transmitted light at 0° and backscattered light at 135°. Transmission is generally more informative for transparent materials, while backscattering enables analysis of opaque, optically dense emulsions and suspensions.3,4
Both signals are influenced by the concentration and size of the dispersed phase. Repeated scans over time produce transmission and/or backscattering profiles that vary with sample height and aging time. Comparing successive profiles reveals changes too subtle for visual detection.
The position and pattern of these changes provide useful mechanistic information. A developing difference near the bottom or top of the vial may indicate sedimentation or creaming and permits tracking of migration kinetics. A change throughout the bulk, without a clear migration front, may reflect a shift in particle or droplet size associated with flocculation or coalescence. The formation and expansion of a transparent layer or boundary can also be followed as phase separation progresses.4
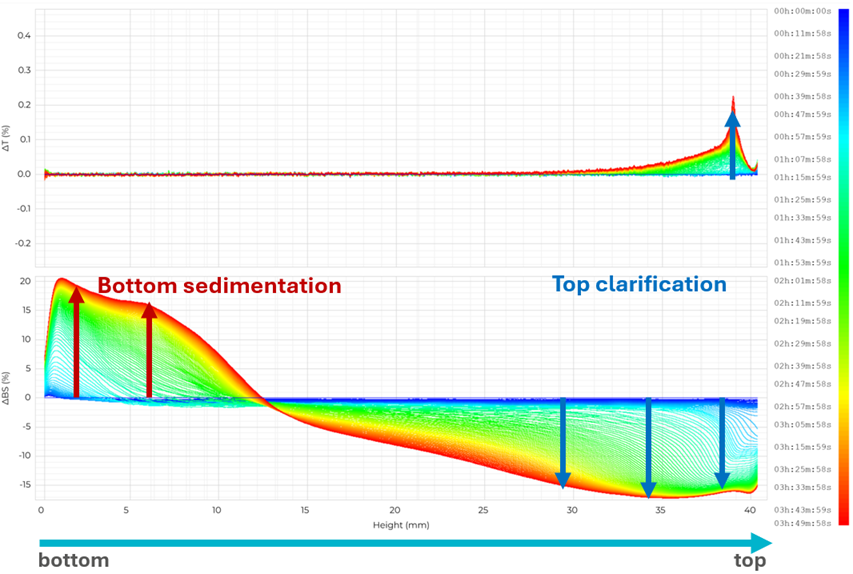
Image Credit: Microtrac
SMLS therefore delivers more than an early pass/fail assessment: it can help determine whether instability results mainly from migration, microstructural change, or both. Importantly, TURBISCAN performs this analysis without dilution. Dilution can change collision frequency, interparticle forces, viscosity, and stabilizer equilibria – factors that control stability – and may promote coalescence, aggregation, or deflocculation.4 Measuring the original formulation maintains these concentration-dependent interactions and prevents sample-preparation artifacts.
Turning Early Signals into Faster Decisions
Transmission and backscattering profiles show where and how a sample is changing, while the Turbiscan Stability Index (TSI) converts cumulative scan-to-scan changes in either signal across the measured sample height into one reproducible numerical value.4 This provides development teams with an objective way to compare formulations instead of depending on subjective terms such as “slight separation.”
The measurements can also inform targeted formulation choices. For instance, formulators can evaluate how surfactant level, homogenization conditions, or raw-material choice influence migration and particle-size evolution. Candidates can then be improved or set aside based on measured instability kinetics, reducing the number of samples that need to enter extended storage studies.
Image Credit: Microtrac
A Proactive Formulation Tool
TURBISCAN identifies changes before instability becomes visible, including minor movement of particles or droplets, early shifts in effective size, emerging migration fronts, and the initial development of phase separation. By monitoring these effects throughout an intact, undiluted sample, the instrument converts a seemingly stable vial into quantitative physicochemical data.
Applied this way, TURBISCAN is not merely a means of recording stability. It functions as a proactive development resource, enabling scientists to identify vulnerable formulations sooner, base optimization choices on evidence, and limit repeated rounds of storage, failure, and reformulation. This supports stronger confidence in candidate selection, faster development timelines, and earlier advancement of stable formulations toward commercialization.
References and Further Reading
- Microtrac (2024). TURBISCAN LAB Stability Analyzer. Available at: https://www.microtrac.com/products/static-multiple-light-scattering/turbiscan-lab/.
- Hu, Y.-T., et al. (2017). Techniques and methods to study functional characteristics of emulsion systems. Journal of Food and Drug Analysis, 25(1), 16–26. DOI:10.1016/j.jfda.2016.10.021. https://www.sciencedirect.com/science/article/pii/S1021949816301831?via%3Dihub
- Zalewska, A., Kowalik, J., and Ireneusz Grubecki. (2023). Application of turbiscan lab to study the effect of emulsifier content on the stability of plant origin dispersion. Inzynieria Chemiczna I Procesowa/Chemical and Process Engineering. DOI:10.24425/cpe.2019.130214. https://journals.pan.pl/dlibra/publication/130214/edition/113697/content
- Bru, P., et al. (2004). Particle Size and Rapid Stability Analyses of Concentrated Dispersions: Use of Multiple Light Scattering Technique. ACS Symposium Series, 45–60. DOI:10.1021/bk-2004-0881.ch003. https://pubs.acs.org/symposium/edited-volume/4166/chapter-abstract/243161716/Particle-Size-and-Rapid-Stability-Analyses-of?redirectedFrom=fulltext
- Celia, C., et al. (2009). Turbiscan lab® expert analysis of the stability of ethosomes® and ultradeformable liposomes containing a bilayer fluidizing agent. Colloids and Surfaces B: Biointerfaces, 72(1), 155–160. DOI:10.1016/j.colsurfb.2009.03.007. https://www.sciencedirect.com/science/article/abs/pii/S0927776509001088?via%3Dihub
- Kowalska, M., et al. (2021). The quality of emulsions with new synthetized lipids stabilized by Xanthan Gum. Biomolecules, 11(2), 213. DOI:10.3390/biom11020213. https://www.mdpi.com/2218-273X/11/2/213
- Rozenn Langlet, et al. (2024). Using static multiple light scattering to develop microplastic-free seed film-coating formulations. Molecules, 29(23), 5750–5750. DOI:10.3390/molecules29235750. https://www.mdpi.com/1420-3049/29/23/5750
- Shen, H., et al. (2026). Development and validation of a static multiple light scattering (SMLS) method for real-time colloidal stability assessment in nanoparticle formulations. Journal of Pharmaceutical Analysis, 16(3), 101396. DOI:10.1016/j.jpha.2025.101396. https://www.sciencedirect.com/science/article/pii/S2095177925002138?via%3Dihub

This information has been sourced, reviewed, and adapted from materials provided by Microtrac.
For more information on this source, please visit Microtrac.