The processes used to reduce the dielectric constant of a low-kappa (low-k) film can negatively affect its mechanical properties. During manufacturing, low-k films are subjected to a range of processes that challenge their structural integrity and adhesion to the underlying substrate. Examples include chemical-mechanical polishing (CMP) and wire bonding. These materials must be capable of withstanding plastic deformation during these processes while remaining intact and avoiding blister formation from the substrate.
Ideally, a dielectric material should exhibit high hardness and elastic modulus, as these properties have traditionally been used to predict how materials will respond to manufacturing processes. This article investigates the mechanical behavior of several low-k samples through ramp-load scratch testing, and examines the results alongside nanoindentation data, using correlation analysis to understand their interdependence.
About the Samples
Ten low-k samples were supplied by SBA Materials, Inc. for scratch testing. Each film was deposited onto a silicon substrate by spin coating. Film thickness varied across the samples, ranging from 375 nanometers (nm) to 743 nm. Measurements of film hardness and elastic modulus were also provided for each sample. These mechanical properties were collected using a Nano Indenter® G200 instrument and a special testing method designed to measure the substrate-independent properties of low-k dielectric films.1
Test Methodology
All scratch tests were conducted using the Nano Indenter G200 system. This instrument is powered by electromagnetic actuation, allowing it to operate across a broad dynamic range of force and displacement.
The instrument is designed to minimize lateral displacement artifacts during the scratch process. In addition to evaluating scratch and wear behavior, the Nano Indenter G200 system can measure Young’s modulus and hardness in accordance with ISO 14577. Its measurement capabilities cover six orders of magnitude in deformation, from nanometers to millimeters.
A ramp-load scratch test was selected for this investigation. Three tests were conducted on each wafer in three locations, generating a total of nine tests for each sample. During a ramp-load scratch test, a tip is first brought into contact with the sample. Then the tip is loaded at a constant loading rate while the sample is simultaneously translated.
Surface topography is measured with a single-line scan both before and after the scratch test to assess the deformation caused by the test. As a result, each scratch test comprises three steps: an initial single-line surface scan, the ramp-load scratch test, and a final single-line surface scan to evaluate the residual deformation.
Additional pre- and post-scan measurements are taken before and after each step, usually covering 20% of the scratch length. These scans enable the software to automatically align the measurement data obtained during the three stages of the test. Comparing the original and residual single-line scans makes it possible to identify the deformation mechanisms involved and quantify the extent of deformation.
Figure 1 shows the complete scratch-testing procedure.
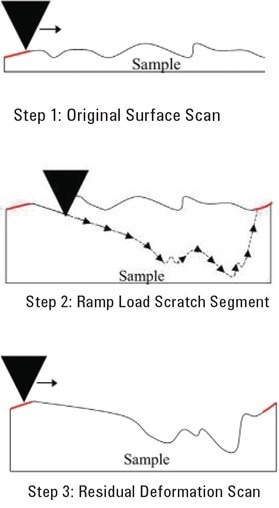
Figure 1. Diagram of the three-step ramp-load scratch test. Red lines show the areas of pre- and post- profile scans used to perform leveling of the three steps. Image Credit: KLA Instruments™
For meaningful comparisons between samples, testing conditions must remain unchanged throughout the investigation. All the test parameters and tip geometries must be consistent across the entire sample group. This ensures that qualitative comparisons can be made using the resulting data.
The tip used in these scratch tests was a cube-corner tip. Its tip radius was nominally less than 20 nm. A cube-corner tip produces a triangular projected contact area against the sample surface, generating high levels of stress within the material during scratching. When using a pyramid-shaped indenter, the scratch direction can be configured as either face-forward or edge-forward. In the face-forward configuration, the cube-corner tip acts like a snowplow and pushes the material aside. The edge-forward orientation acts like a knife, cutting through the material. In the investigation detailed in this article, the low-k samples were tested using the face-forward orientation of the cube-corner tip.
Figure two shows a cube-corner indenter.
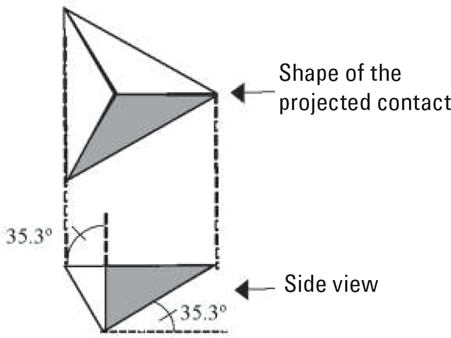
Figure 2. Diagram of a cube-corner tip. Image Credit: KLA Instruments™
Study Results
Film Failure
The 10 low-k films demonstrated similar failure behaviors. Initially, the materials underwent plastic deformation. At a critical threshold, blister formation occurred. This was followed by complete failure of the film, after which the substrate was scratched for the remainder of the test.
To investigate the failure mechanism in more detail, a typical scratch test was analyzed using scanning probe microscopy. This imaging capability is available on the Nano Indenter G200 system through the NanoVision option.
NanoVision uses a high-precision piezo translation stage to generate surface images. The system provides lateral resolution and travel flatness of better than 2 nm, making it suitable for quantitative surface imaging and high-precision targeting when investigating material properties.
The scratch test for the imaging analysis was continued until complete film failure occurred. The displacement results are shown in Figure 3. The software automatically identified the critical load by analyzing the residual displacement curve.
To establish the critical load point, NanoSuite software examined the rate at which displacement changes in the residual scan, represented by the orange trace in Figure 3. Based on those measurements, the software extrapolates the displacement curve for the next data point based on the change in the scratch distance.
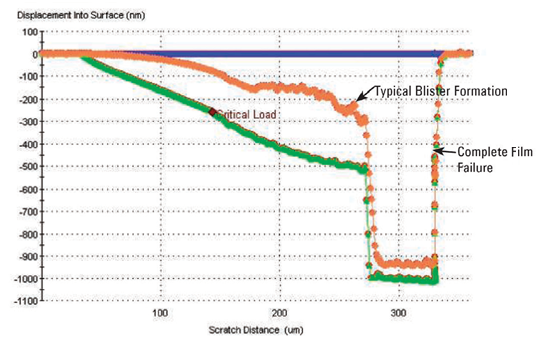
Figure 3. The displacement into surface versus scratch distance data for the scratch that was used for imaging to further examine failure; the blue trace is the original surface topography, the green trace is the scratch curve, and the orange trace is the residual deformation. The locations of blistering and total film failure are labeled. Image Credit: KLA Instruments™
The predicted displacement is then compared with the actual observed displacement. The magnitude of the differential is recorded as the residual roughness level.
Figure 4 presents the residual roughness measurement together with the residual deformation of the scratch. For visual clarity, the residual roughness channel has been multiplied by a factor of three, allowing it to be displayed alongside the displacement curves.
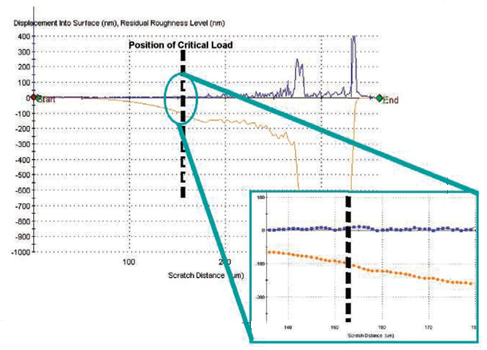
Figure 4. Residual roughness (blue) and the residual deformation scan (orange) versus scratch distance. Image Credit: KLA Instruments™
The critical load was placed where the residual roughness exceeded 3 nm. At this position, the difference between the predicted and experimentally observed displacement is greater than 3 nm. The acceptable tolerance for determining the critical load depends on the surface roughness measured during the initial pre-profile surface scan.
Further investigation of the blistering and failure mechanisms of the low-k films was undertaken by imaging the scratch test presented in Figure 3 using NanoVision. The resulting top and side views are shown in Figure 5. These images clearly show substantial material blistering immediately before the failure of the film. The measured height indicates that the blister extended approximately 400 nm above the film surface.
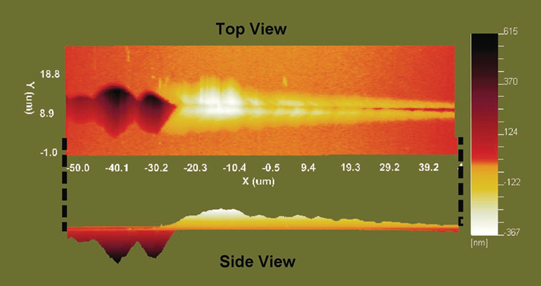
Figure 5. Typical blistering and failure in the low k films. Scratch imaging was performed using the NanoVision option. Notice that the film has blistered up approximately 400 nm from the surface. Image Credit: KLA Instruments™
Blister formation is not typically measured accurately through the residual scan of a scratch test. This is because the film supports very little load parallel to the scratch direction and is usually pushed down by the profiler.
To overcome this limitation, NanoVision was used to scan the scratch deformation in the transverse direction, making it possible to examine the blister structure in greater detail.
An additional measurement was performed at the initial onset of blister formation to distinguish actual blistering from pile-up. The resulting image is shown in Figure 6. The scan shows that the residual scratch depth increases until blistering occurs. Once blistering begins, the residual deformation in the film is lifted upward and away from the substrate. If pile-up had occurred, the residual scratch depth would have continued to increase as the scratch test progressed.
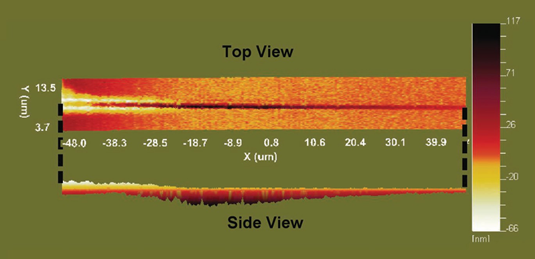
Figure 6. Typical scratch tests in the low k films showing the start of blistering. Notice that the residual scratch depth increases until blistering occurs. Following the start of blistering, the residual deformation in the film has been lifted upwards. Image Credit: KLA Instruments™
Scratch Test Results
Table 3 summarizes the scratch test measurements taken from all 10 samples. The sixth column reports the amount of elastic deformation that occurred during the scratch test up to the point of film failure.
Elastic and plastic deformation were determined by measuring the areas between the scratch curve and the original surface topography, together with areas between the residual deformation scan and the original surface topography.
This resulted in a new parameter: percent of elastic deformation up to critical load. This provides additional information about the film’s ability to resist permanent deformation. Rather than considering only the load at which failure takes place, this measurement also characterizes the type of deformation occurring up to film failure. Figure 7 illustrates the elastic and plastic deformation regions, which are shaded on the corresponding scratch curves.
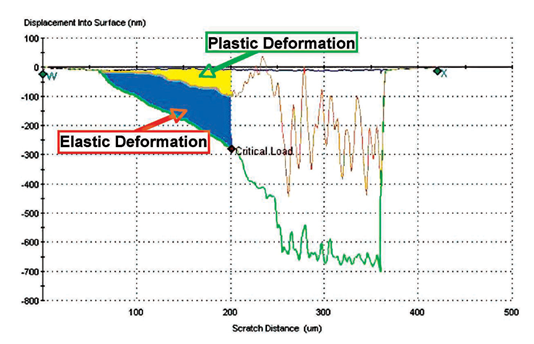
Figure 7. Elastic and plastic deformation of a scratch test performed on Sample J; the elastic deformation is shaded in blue and the plastic deformation is shaded in yellow. Sample J film thickness is 650 nm. Image Credit: KLA Instruments™
Figures 8 and 9 show the results of critical load, total deformation, the percent of penetration, elastic deformation, and elastic modulus for the four highest-performing samples, identified as B, C, E, and J. These samples were selected based on their critical-load measurements.
The comparisons reveal subtle differences between the top performers. Samples B and J had the highest critical loads across the sample group. Their measurements did not demonstrate a statistically significant difference in critical load. Sample J produced a considerably smaller standard deviation, indicating that it is more repeatable and predictable.
Sample C exhibited the second-lowest total deformation and the greatest elastic deformation among the four leading samples. This result is particularly noteworthy because Sample C was approximately 100 nm thicker than the other samples. Despite having a greater film thickness and more material available to accommodate deformation as a result, it demonstrated the highest resilience against deformation of all the samples. Its critical load performance was also comparable to that of the other leading materials.
Sample E also produced notable results. Its film was approximately 100 nm thinner than those of the other highest-performing samples. Although it did not achieve the maximum critical load, it recorded the lowest total deformation and one of the highest percent penetration values at the critical load.
These results were presented to the manufacturer, who disclosed that samples E and J had the same chemical composition but were prepared using different solvents during the spin-coating dilution process.
The difference in critical-load measurements between these samples could potentially be attributed to either film thickness or the use of different solvents. However, the information available is not enough to establish which factor was directly responsible for Sample E’s lower critical load.
The percent penetration values shown for samples E and J in Figure 9 suggest that film thickness may be the main cause. However, the use of different solvents during sample preparation prevents a definitive conclusion regarding the cause of the lower critical load.
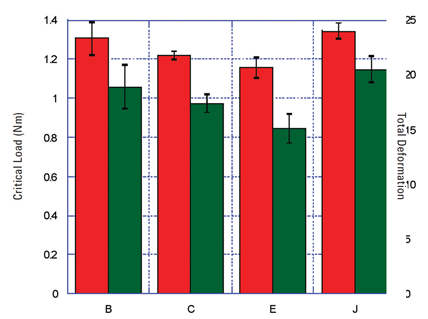
Figure 8. Critical load and total deformation for the four top-performing samples (based on critical load). Ideally, critical load results would be high and total deformation results would be low. Image Credit: KLA Instruments™
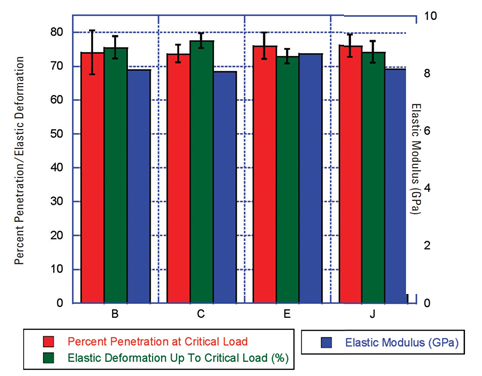
Figure 9. Percent penetration/elastic deformation and elastic modulus for the four top-performing samples (based on critical load). Image Credit: KLA Instruments™
These two samples showed statistical differences in the results for elastic modulus, which confirmed that the films had slightly different mechanical properties.
Correlation of Results
When evaluating a large collection of experimental measurements, it is possible to concentrate on large numerical differences in single columns and overlook other significant independent results. Correlation analysis helps identify patterns and ensures that the sample results are analyzed based on independent results rather than on groups of results that have strong correlations to a single parameter.
An example of a strong linear correlation can be seen in Figure 8, which demonstrates a strong correlation between the critical load and total deformation. If these two parameters were considered independently as the primary indicators of film performance, both results would draw the same conclusion.
However, correlations are not always as obvious as the sample presented in Figure 8. In this case, the correlation is easily recognized because there is a 97% linear correlation between the two results. Relationships become considerably more difficult to identify when correlation values fall below approximately 60%.
A conventional correlation analysis was performed to evaluate the correlation between the results in these scratch tests.2
Four categories were established to classify the strength of the correlations between the measured parameters:
- Very weak correlation: 40 to 50%
- Weak correlation: 50 to 60%
- Moderate correlation: 60 to 75%
- Strong correlation: Over 75%
The correlation analysis indicates that nearly all measured parameters exhibit at least a weak dependence on film thickness. The exceptions are hardness and elastic modulus, which were measured using a test method specifically developed for measuring substrate-independent properties.
For example, approximately 67% of the variation in critical load can be explained by a linear relationship with film thickness. However, these results should not be disregarded based on this correlation, as it is only a moderate correlation. Sample E provides an obvious exception: it was one of the thinnest samples but also had one of the highest critical load measurements.
Several of the identified correlations are consistent with the expected mechanical behavior of the materials. For instance, percent penetration and total deformation exhibit 86% correlation. This relationship is reasonable because greater penetration at the point of film failure would generally be expected to produce a large overall deformation.
When the total deformation is correlated to the penetration depth at critical load, as opposed to percent penetration normalized by film thickness, the correlation factor increases to over 98%.
Other findings were less expected. In particular, there was almost no correlation between the scratch test measurements and the values of hardness, elastic modulus, and percent elastic deformation. There may not be a correlation to hardness because the interface between the film and substrate failed prior to the failure occurring in the film itself.
Conclusion
Ramp-load scratch testing was used for evaluating the scratch response of low-k films on silicon substrates. All samples exhibited blister formation before complete film failure occurred. Imaging with NanoVision was used to confirm the failure mechanism.
In addition to identifying statistically significant differences between the scratch test measurements, correlation analysis was conducted to establish relationships between the various experimental parameters.
The analysis showed that all scratch results had at least a very weak correlation to film thickness. This apparent dependence on film thickness is consistent with the expected behavior of materials during conventional scratch testing because the film does not fail until the probe has significantly penetrated it. This means that the stresses from the scratch test propagate well into the substrate.
The analysis also revealed several unexpected findings. Neither hardness nor elastic modulus correlated with any scratch parameter, and the percent elastic deformation up to the critical load did not correlate with any result other than film thickness. Again, this correlation was weak.
Based on the overall findings, Sample J was identified as the best-performing sample because it resisted deformation, withstood a high percentage of penetration, and supported the highest load before failure.
Although Sample B produced results that were very similar to those of Sample J, Sample J was selected because the tests contained a lower standard deviation. This demonstrated that it was more repeatable and predictable.
The researchers used materials and certain results supplied by SBA Materials.
References and Further Reading
-
-
Freund, J.E. (1992) Mathematical statistics. 5th edn. New York: Prentice Hall.

This information has been sourced, reviewed, and adapted from materials provided by KLA Instruments™.
For more information on this source, please visit KLA Instruments™.