Machine condition monitoring through oil analysis is a proven and cost effective maintenance management technique. Periodically, however, the ability and the need to detect large wear particles is questioned and papers have been published which attest to the fact that spectroscopy is more or less blind to the larger wear particles in an oil sample. Nevertheless, used oil analysis has been shown to be extremely effective in predicting potential machine failures. It is thus not unrealistic to ask the question “are there benefits to additional tests, and will they significantly improve the probability of detecting a potential failure that may otherwise be missed by conventional analytical methods?”
This paper discusses three techniques that can be used to improve the ability of optical emission spectrometers to detect and quantify large wear particles in lubricating oil. They are an acid digestion differential method, ferrography and rotrode filter spectroscopy.
Introduction
Many excellent reports and articles have been written on the subject of oil analysis and its historic evolvement. Simply stated, oil analysis is a diagnostic maintenance tool used to detect and quantify wear metals and contaminants in the lubricant of oil wetted systems. It is based on the fact that a representative sample of lubricant, when periodically analyzed, provides important information on the condition of the wearing surfaces. It is a test that helps to determine whether a mechanical system is in a normal wear mode, or whether a potentially serious problem exists.
A fact which has recently become more widely understood is that spectrometric oil analysis detection efficiency decreases as the wear particle size increases. Large particles are precisely those particles which are most indicative of an abnormal wear mode. Severe wear modes such as spalling, severe sliding wear and cutting wear generate large particles which may go undetected by spectroscopy. This is true to a greater degree for certain types of spectrometers than others. It is also more important for certain types of machines and engines.
Atomic absorption spectroscopy (AAS) and inductively coupled plasma (ICP) spectrometers suffer the most from particle detection inadequacies. Rotating disc electrode (RDE) spectrometers are responsive to somewhat larger particles, but the upper limit is still approximately 10 micrometers.
This paper presents several methods that have been developed over the last ten to twenty years which improve the large particle detection capabilities of emission spectrometers. They are an acid digestion differential method (ADDM) using inductively coupled plasma (ICP) spectroscopy, a metal separation technique called ferrography, and rotrode filter spectroscopy (RFS) using rotating disc electrode (RDE) spectroscopy. The ultimate goal in each is to detect the relatively small percentage of failures missed by routine spectrometric oil analysis techniques.
Atomic Emission Spectroscopy - Definition of the Problem
Detection of large particles by atomic emission spectroscopy is influenced by a number of factors. The most important are described below.
Representative Sample
If a system is in a severe wear mode and generating large wear particles, the oil sample taken to the laboratory for analysis must contain a representative quantity and size distribution of particles. The size of the sample and good sample taking technique can be an important factor. Likewise, the sample must be vigorously shaken to re-suspend particles before measurements are made in the laboratory.
Excitation Parameters
The type of excitation influences the particle size detection capability of spectrometric techniques. Excitation power to dissociate a particle is the key factor. However, the hottest source, an inductively coupled plasma (ICP), is limited by short sample residence time in the plasma. Depending on composition, particles may not be in the plasma long enough to dissociate and vaporize.
For the rotating disk electrode (RDE) method, an arc source has better efficiency for certain elements, but for others a spark source is preferred.
Oil Viscosity
For the RDE method, the viscosity of the oil has an effect on the quantity of the sample reaching the excitation process and thus the quantity of wear particles carried with it. This is further influenced by the porosity of the disk electrode. Viscosity is less of a factor with AAS or ICP-AES since most oil samples must be diluted before analysis, eliminating viscosity as a major variable.
Morphology of Wear Particles
The shape of a particle has an effect on the efficiency of the spectrometric technique. For example, rubbing wear particles have a length to thickness ratio of about 10:1. Powdered metals are often more or less spherical. If both types are described by their major dimension, spherical particles of the same dimension as wear particles will be more difficult to excite.
Lubricant Composition
It has been shown that the efficiency of the analytical technique varies between hydrocarbon oils and ester oils.
Quantity of Sample Introduced into the Excitation Process
The ability to measure large wear particles presumes that they are present in the small quantity of sample that is actually excited. For a typical 1 ml oil sample, less than 50% is subjected to analysis with the RDE method, and only a few percent for the ICP method. If there are only a few large particles present per milliliter of sample, the probability of detecting those particles is thus greater for the RDE technique.
Method of Sample Introduction
In the ICP method, the sample is nebulized to form an aerosol. By the time the aerosol reaches the plasma, the droplet size is very fine, typically less than 5 mm. Consequently, wear particles larger than 5 mm have no chance of being detected.
Methods to Analyze Large Wear Particles Used In Oils
The three techniques described in this section to detect large wear particles in used lubrication oil are not theoretical. They are methods that are used in actual practice as an additional test and as an integral part of machine condition monitoring programs.
Acid Digestion Differential Method
It was recognized more than ten years ago that in spite of the extensive application of spectrometers for oil analysis, no analytical procedure was available which satisfied all requirements in regard to speed of analysis, precision, accuracy, sensitivity, convenience of sample preparation, and cost per analysis. Inductively coupled plasma (ICP) spectrometry was shown by Fassel, et al. to be more capable in satisfying all of these requirements. However, the ICP method, as routinely applied to used oil analysis, has very poor particle sensitivity. An oil sample, diluted by solvent to lower viscosity, is nebulized to create an aerosol which flows through a spray chamber before reaching the plasma.
The spray chamber removes all but the finest droplets by settling and impaction, so that the maximum droplet size reaching the plasma is approximately 5 mm. Consequently, particles in the sample larger than 5 mm have no chance of being detected.
Justification
If spectrometric measurements are made as a function of time after an engine oil change, the wear metals concentration will continue to increase indefinitely, as shown in Figure 1, so long as clean make-up oil is not added to the engine.
In fact, for spectrometric measurements to be meaningful, the time since the last oil change must be known, because it is the increase in wear metals concentration during a given operating period that is of significance. Spectrometric data for aircraft gas turbine engines are a special case. Absolute maximum concentration levels apply to gas turbine engines because even though the oil in most gas turbine engines is not changed, the wear metals concentration reaches a maximum due to the frequent addition of make-up oil. Kjer describes the mathematics of wear particle concentration for small and large particles and for topping-off.
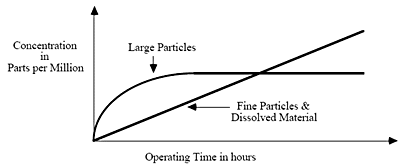
Figure 1. Particle concentration as a function of time
From the foregoing discussion, it may be seen that the total metals concentration in a lubricating oil sample is the total of two components: the fine particle and chemically dissolved portion and the large particle portion. The concentration of the fine particle and chemically dissolved fraction continues to increase between oil changes, but the large particle fraction reaches a dynamic equilibrium concentration, wherein the contribution of generated wear particles is offset by the loss of large particles to filters, settling or comminution. The concentration of large particles is of the greatest interest in regard to abnormal wear, because the quantity and size of large particles increases substantially for many, and probably most, abnormal wear modes. Also, the contribution of the large particles to the total wear metals concentration is often a much smaller fraction than the contribution of the fine particles and dissolved material.
In order for spectrometric analysis to be as effective as possible in providing early indication of abnormal wear, it is not always sufficient to monitor only the total wear metals concentration by a particle size independent method. Anderson suggests that a differential method be considered, at least for critical equipment having a history of rapidly developing failure modes, wherein two measurements are made on each sample. An ICP spectrometer is recommended for this procedure because of its superior precision, accuracy and limits of detection. One measurement is made by directly introducing the sample to the plasma after diluting it with solvent by an appropriate ratio. This measurement gives the fine particle fraction. The second measurement is made using a particle size independent method to arrive at a total metals concentration. The difference between the two measurements is an indication of large particle fraction.
The large particle fraction is expected to remain within certain limits during trouble free operation, even as the lubricant experiences more operating time. Abnormal wear modes, filter clogging, contaminant ingestion, lubricant failure, etc. are expected to significantly increase the large particle fraction.
Case Histories, Reciprocating Engine Test Stand
Two series of oil samples were obtained from reciprocating engine test stands. Series A samples show no increase in the severity of wear during the course of the test as determined by ferrographic analysis. The quantity of large particles is approximately the same in all Series A samples.
Ferrograms prepared for Series B samples show a substantial increase in the concentration of large particles as the test proceeds. Each sample from Series A and Series B was heated, homogenized by shaking, and split into two portions. One portion was left as is; an acid digestion following the method of Brown, et al, was performed on the other portion.
All portions were weighed on an electronic balance, as was the acid and solvent (kerosene) added to each portion, so that concentration data could be accurately calculated. Each portion was then analyzed by ICP-AES so that two measurements were obtained for each sample:
- ICP-AES without acid digestion.
- ICP-AES with acid digestion.
Figure 2 shows iron results for Series A samples. Little difference is obtained between measurements with and without acid digestion. Figure 3 shows progressively greater difference between the two methods for Series B samples. Figure 4 plots the difference between the two methods as the engine test proceeds.
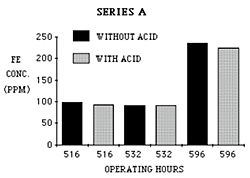
Figure 2. Iron results for Series A
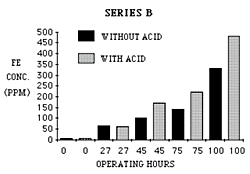
Figure 3. Iron results for Series B
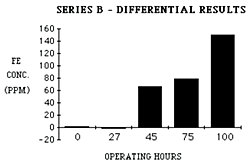
Figure 4. Difference between digested and undigested samples for Series B samples
The power of this differential acid digestion technique is that it is able to indicate the presence of large particles in situations where the concentration is increasing, as measured either by routine techniques or particle size independent techniques. In one case, Series A, there is no increase in large particles, only normal wear may be said to be on going, whereas in Series B a progressive increase in wear severity is occurring. Without differential measurements, either case appears to show an increasing trend.
Ferrography
The ferrography technique was developed in the 1970’s to overcome the large particle detection deficiencies of spectrometric oil analysis. It is a technique for the separation of particles from fluids for microscopic examination and subsequent analysis. The name, ferrography, derives from the initial development of the methods to precipitate ferrous wear particles from engine lubricating oil.
The original analytical ferrograph used a strong magnetic field gradient to separate wear particles from the used oil sample for subsequent microscope examination. Since that time, a number of different instruments have been introduced such as the rotary particle depositor which also separates wear particles for microscopic examination along with other instruments which quantify the amount of ferrous wear debris in an oil sample.
The primary instrument in ferrography is the analytical ferrograph which is used to prepare a ferrogram. A non-wetting barrier is painted on one surface of a microscope slide. This coating traps the fluid delivered by a peristaltic pump. In use, the slide is mounted at a slight angle to the horizontal, permitting the fluid to flow by gravity along the glass, but within the barrier, where it finally is picked up by a drain tube.
The slide is mounted above two permanent magnets which are separated by an aluminum sheet. The poles of the magnets are counterposed. That is, where one magnet pole is considered north, the pole of the other magnet across the aluminum strip is south. Positioning the magnets in this way causes a strong magnetic field gradient to be created in the vertical direction above the aluminum strip. Magnetic particles in the fluid experience a strong downward force. These particles migrate through the fluid down to the glass surface, where they are deposited in strings perpendicular to the direction of fluid flow, Figure 5.
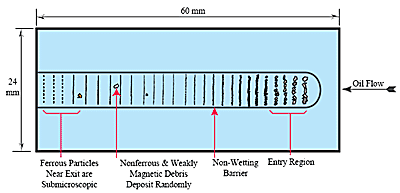
Figure 5. Example of a Ferrogram
After all the fluid in a given sample has run across the slide, a fixer solution is passed over the slide to remove residual fluid. When the fixer has evaporated, the slide is ready for observation using the microscope. Ferrous particles are deposited on the slide according to size. The force acting on a particle is proportional to volume, but the viscous resistance of the suspending fluid is proportional to surface area. Therefore, for spheres, force increases with the cube of the diameter, but resistance increases only with the square of the diameter. The largest ferrous particles, therefore, are deposited at the entry region of the slide where the lubricating oil first touches down on the glass surface. At a position farther along the slide, all ferrous particles larger than a characteristic size already will have been precipitated.
For non-ferrous particles, such as aluminum, brass, white metal, etc., precipitation will often occur because these materials are weakly magnetic, however, the deposition of these materials will be less size-selective. Consequently, large particles of nonferrous metal may be found anywhere along the length of the slide as also shown in Figure 5. Examination of the slide in a bichromatic microscope reveals details of size, shape, and number of particles. From this information the condition of oil-lubricated parts may be assessed. Machines operating normally usually generate small flat particles at a slow steady rate. If the number of particles increases, and particularly if the ratio of large to small particles increases, we have an indication that a more severe mode of wear has begun.
The generation of large severe wear particles signals the imminent failure of the wearing surface. Abrasive wear, analogous to a crude machining process, generates particles in the form of loops, spirals, and bent wires as shown in Figure 6. Increase in the number and size of these particles shows that an abrasive wear mechanism is progressing rapidly.

Figure 6. Sample of cutting wear
Types of Wear
Different wear mechanisms each generate characteristic particles. Six regimes of wear have been identified with sliding wear. Miscellaneous shaped particles are associated with break-in wear. Small platelets are associated with normal rubbing wear. A sample of sliding and rubbing wear are shown in Figures 7 and 8.

Figure 7. Sample of sliding wear

Figure 8. Sample of rubbing wear
As operating parameters become more arduous, the metallic rubbing wear particles increase in size and become oxidized. Finally, just prior to failure, large, metallic, severe wear particles are produced.
In addition, two types of particles are associated with rolling mechanisms. These are fatigue chunks and laminar particles. Fatigue chunks represent material removed as rolling elements spall, Figure 9. Laminar particles, which are large, thin plates, result from material being passed through the rolling contact. Combined rolling and sliding, as in gears, produces scuffing particles and fatigue chunks. Determination of the composition of particles can establish their origin. The site of deposition, reflectivity, and color of particles aid in their identification.

Figure 9. Sample of Fatigue Spall Particle
If available, energy dispersive x-ray analysis in conjunction with a scanning electron microscope, can establish elemental composition. Otherwise, simple heating of the slide will allow categorization into broad alloy classes by examination of oxide layer (temper) colors.
Case History, Water in the Oil
Used oil samples were taken from a 1200-kW, turbine-driven reduction gearbox that had just been overhauled. A wear particle baseline was established after five days of operation. No severe oxides or crystalline particles appeared on the ferrograms at that time. The only reservation the analyst had was that a certain number of dark metal oxides were found at the entry deposit. The oil sample taken after one month of operation, however, reflected a greatly deteriorated wear situation. Many red oxides, as well as free metal particles with tortured and oxidized surfaces, were found. Figure 10 shows the entry view of that ferrogram in polarized, reflected light. Water in the lubricant not only caused an oxidative attack, but the load carrying ability of the lubricant was reduced, resulting in large, abnormal wear particles. As a result of the tests, oil-water separators were installed in the lubricating system and follow-up sample analysis returned to normal.

Figure 10. Entry region of ferrogram showing red oxides and free metal particles
Case History, Abrasive Wear
Figure 11 is a ferrogram from a used oil sample taken from a compressor. It shows heavy strings of ferrous wear particles, as well as many large nonmetallic crystalline particles. A comparison with a baseline sample shows the current ferrogram deposit to be extremely heavy. Closer examination at higher magnification shows that large cutting wear particles dominate the ferrogram, Figure 12.

Figure 11. Ferrogram from compressor used oil sample

Figure 12. Cutting wear particles and abrasives at 500X magnification
Because there are many nonmetallic crystalline particles, the assumption was made that the cutting wear was due to abrasive contamination, and a recommendation was made to change the oil and oil filter and examine the machine for possible means of entry of contaminants. Another sample from that compressor was submitted a month later. Wear particle concentration and particle size, shape and composition has returned to baseline.
Rotrode Filter Spectroscopy
Rotrode filter spectroscopy makes use of the fact that the carbon disc electrodes used in rotating disc electrode (RDE) spectrometers are themselves porous. A fixture is used to clamp the discs so that used oil samples can be drawn through the outer circumference of the disc when a vacuum is applied to the inside of the discs, Figure 13. The particles in the oil are captured by the disc. The oil is then washed away with solvent, the disc is allowed to dry, and the particles are left on the outer circumference of the disc electrode so that they are vaporized and detected when sparked on the RDE spectrometer.
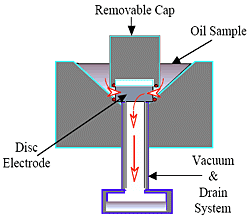
Figure 13. RFS sample preparation fixture
The disc electrode acts as a substrate for the wear and contaminant particles which become the actual sample for analysis. A pointed graphite rod is used as the counter electrode to create a spark between the electrodes resulting in the excitation of the atomic structures of any wear metals or contaminants captured by the disc electrode. The analytical procedure is identical to the analysis of a routine sample with the RDE technique.
Sample preparation time of an electrode for RFS varies with the viscosity and contamination of the oil sample. Preparation time can be as short as 4 or 5 minutes for relatively clean used lubricating oil samples, such as from turbines, electric motor bearings and hydraulic systems. Engine oil samples with high soot levels require the longest filtration times, sometimes half an hour or more. A multi-station fixture is thus used so that a number of samples can be filtered at one time, Figure 14. The procedure thus becomes economically efficient to perform.

Figure 14. Multi-station RFS sample preparation fixture
Application of RFS Technique
The RFS technique is used as a comparative method due to the unavailability of oil standards with known gravimetric concentration of particles for each element measured by the spectrometer. In practice, a used oil sample is first analysed using the standard RDE technique which provides an analysis of dissolved and “fine” wear particles. A second analysis using the RFS technique detects and quantifies the larger “coarse” wear particles. The two analyses provide an indication of the wear particle size distribution in the sample. A sudden presence of large wear particles will not be seen by conventional analysis. Their presence, will however, be readily evident through the RFS analysis.
Case History, Bearing Water Due to Coupling Misalignment
Condition monitoring based on vibration and oil analysis has been a major focus of most modern paper mills. Many mills have large forced lubrication systems with central reservoirs that serve many bearings on rolls and drives.
In this case history, the maintenance engineer suspected that a problem was occurring with a supercallender main drive motor on a specialty paper process line. Routine oil analysis with conventional methods reported no abnormalities, yet the engineer was not satisfied based on experience, preliminary vibration analysis and visual appearance of the oil sample. A decision was made to also send samples to an independent laboratory for a second opinion and analysis with the RFS technique.
Figure 15 presents the data for the next two samples. Routine spectrometric analysis is labeled as “fine” and RFS analysis is labeled as “coarse.” The first and second samples showed normal values for routine spectrometric oil analysis. Yet the RFS technique identified extremely high values for nonferrous metals. A recommendation to change the oil was made after the first sample and an ALERT condition was reported after the second. The results show severe bearing wear to be taking place and immediate remedial action was suggested by the independent laboratory.
Meanwhile, abnormal vibration data convinced the engineers that their suspicions on the cause of wear were correct, i.e. the motor was not coupled properly, and it appeared to be thrusting away from the gearbox and into both bearing thrust faces. The motor was immediately taken out of service and overhauled.

Figure 15. Fine and coarse wear particle trends for bearing wear mode
One bearing assembly, Figure 16, was replaced. The motor was reinstalled and aligned, eliminating a soft foot. If the motor had remained in service, it would eventually have failed. Maintenance costs, including rewinding of the armature would have cost a minimum of $32,000 and probable production losses and delays would have increased the costs even further.

Figure 16. Damage to bearing surface due to motor misalignment
Conclusion
The objective of a machine condition monitoring program based on oil analysis is to detect problems in the early stages of wear so that economical corrective action can be taken. The required corrective action might take the form of an immediate repair, or in some cases, equipment may be kept in service under controlled conditions and corrective action is postponed until the next scheduled shutdown. In all instances, analytical techniques supply the necessary information on which maintenance recommendations are based. The quality and dependability of the information is thus key to the success of machine condition monitoring program.
Three supplemental techniques to basic spectrometric oil analysis were discussed in this paper. Each provides additional information on the large wear particles that may be present in the used oil sample. Some provide quantitative data and others qualitative data. There is no question that this information is valuable in terms of saved maintenance costs. The techniques vary in cost, complexity and information.
The selection of which supplemental technique to apply depends on the machines being monitored and the experience of the laboratory personnel. The acid differential technique can identify, by element, the presence of large wear particles in lubricating oil samples. It is a two-step method, because the particle size independent technique by itself does not necessarily provide the needed information about abnormal wear.
Ferrography is a technique that separates metal particles from an oil sample for further diagnosis with a microscope. It has proven to be a valuable technique which provides supplemental, and often critical, information regarding the actual sizes of particles and the wear mode that generated them. The information is useful in determining the severity of the wear and the possible source.
Rotrode Filter Spectroscopy (RFS) is a new technique which has been shown in actual field applications to provide important additional information about large wear particles; information that may be missed with conventional techniques.
It is applied with existing instruments with only minor procedural changes. Although the wear particle size limitation of atomic emission techniques is periodically “rediscovered,” it is now safe to say that methods exist which circumvent this so called limitation. This paper has shown three methods that improve the particle detection capability to varying degrees. The overall efficiency of oil analysis can be improved if any of these methods are applied.

This information has been sourced, reviewed and adapted from materials provided by AMETEK Spectro Scientific.
For more information on this source, please visit AMETEK Spectro Scientific.