In the medical applications of ultrasonic imaging, sound waves of high frequency are usually employed to produce in-depth cross-sectional images of internal organs. Special multi-element transducers dubbed as phased arrays and their associated software and hardware are used to make medical sonograms. However, the use of ultrasonic phased array technology is not relegated to medical diagnosis alone.
Recently, phased array systems have been extensively adopted in industrial environments to offer new depths of visualization and information in standard ultrasonic tests that comprise thickness profiling, weld inspection, in-service crack detection, and bond testing. In this application note, the workings and applications of phased array systems in industrial ultrasonic nondestructive testing are discussed in detail.
Phased Array Systems
Traditional ultrasonic transducers for nondestructive testing generally include a single active element or two paired elements. On the other hand, phased array probes include a transducer assembly with tiny individual elements that range from 16 to 256 elements. Each element can be pulsed separately.
Additionally, an advanced computer-based instrument is integrated into a phased array system that can drive the multi-element probe, receive and digitize the returning echoes, and map the echo data in a variety of standard formats. Phased array systems can focus at multiple depths, which improve capability as well as flexibility in inspection setups.
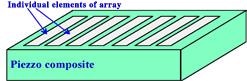
Figure 1. Multi-element construction
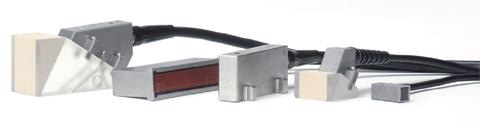
Figure 2. Typical phased array probe assemblies
Mechanism of Phased Array Systems
Basically, a phased array system uses the wave physics law of phasing, changing the time between a range of outgoing ultrasonic pulses in a way that the separate wave fronts produced by each element in the array merge with each other to either add or cancel energy in expected ways which effectively guide and contour the sound beam.
To achieve this phenomenon, individual probe elements are pulsed at sparingly different times. A focal law calculator establishes delay times for firing each group of elements to produce the required beam shape, with regard to wedge and probe characteristics and also the acoustical properties and geometry of the test material.
The instrument's operating software chooses the programmed pulsing sequence, which introduces several wave fronts in the test material. The wave fronts then merge into a single primary wave front that passes via the test material and reflects off back walls, discontinuities, cracks, and other material boundaries.
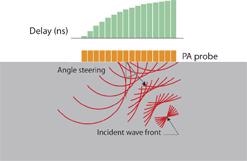
Figure 3. Example of angled beam produced by flat probe using variable delay
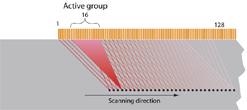
Figure 4. Example of focused linear scan beam
Images Presentation
In standard thickness gaging and flaw detection gaging applications, the ultrasonic test data will be built on amplitude and time information obtained from RF waveforms that are processed. These waveforms and the data obtained from them will be presented in one or more formats such as A-scans, B-scans, C- scans, or S-scans. Some instances of image presentations from phased array systems and traditional flaw detectors are presented in the following text.
A-Scan displays
An A-scan is a RF waveform presentation that displays the amplitude and time of an ultrasonic signal. Moreover, an A-scan waveform denotes the reflections from a single sound beam position in the test piece. In the figure given below, a 45o wedge at a fixed position identifies two of the holes drilled on the side of the test block as they fall within its beam; however, the third hole cannot be detected without shifting the transducer forward. A phased array system shows analogous A-scan waveforms for reference, but in most instances the waveforms will be complemented by B-scans, C-scans, or S-scans as shown in the figures below. With the help of these imaging formats, operators can view the type and location of flaws in a test piece.
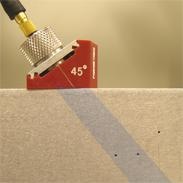
Figure 5. Generalized beam profile
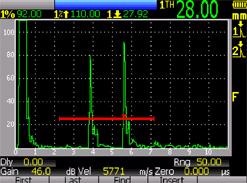
Figure 6. Straight beam A-scan image
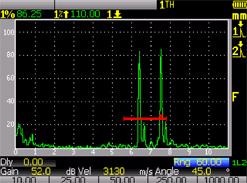
Figure 7. Angle beam A-scan image
B-Scan Displays
In B-scan imaging, the sound beam is examined along the preferred axis of the test piece, while storing pertinent information. In the figure given below, the B-scan displays one shallower reflector and two deep reflectors, corresponding to the locations of the holes drilled on the side of the test block. The transducer has to be shifted laterally across the test piece when a traditional flaw detector is used. On the other hand, a phased array system employs electronic scanning along a linear array probe to produce a cross-sectional profile without shifting the transducer.
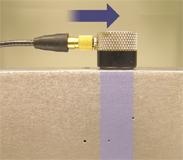
Figure 8. Generalized beam profile
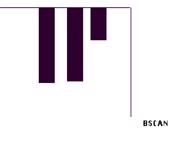
Figure 9. Typical b-scan image showing relative hole depth
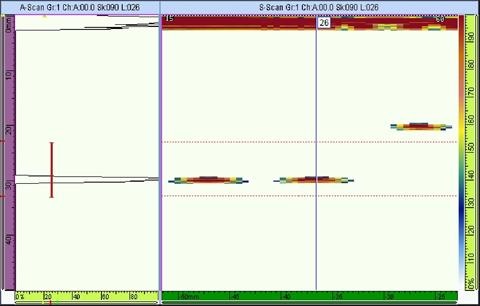
Figure 10. Electronic linear scan (B-scan) image showing relative hole position and depth across the length of a linear array
C-Scan Displays
A C-scan is a 2D presentation of data that is showed as a top view of a test piece, which is identical in its graphic viewpoint to an x-ray image, wherein the gated signal amplitude is denoted by color at each point in the test piece, which is plotted to its x-y position. On the other hand, the single-element transducer has to be shifted in an x-y raster scan pattern across the test piece when standard instruments are employed. But with phased array systems, the probe is shifted manually along one axis while the beam checks along the other axis in an electronic fashion. Generally, encoders are utilized to maintain accurate geometrical correspondence of the scan image. In addition, the phased array image was produced within a short time span, while the traditional immersion scan took more than a few minutes.
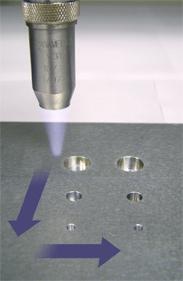
Figure 11. Generalized beam profile and direction of motion
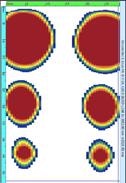
Figure 12. Phased array C-scan image showing hole position
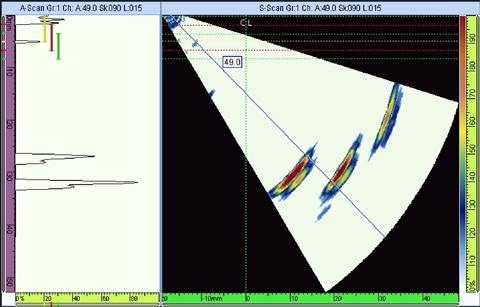
Figure 13. A-Scan of a single angular component at left, composite sectorial scan at right. The cursor marking 49 degrees identifies the angular location of the displayed A-scan.
S-Scan displays
An S-scan denotes a 2D cross-sectional view obtained from a range of A-scans that are mapped in accordance to refracted angle and time delay. This is a common format for industrial phased array images and medical sonograms.
Conclusion
Applications of Phased Array Systems
Ultrasonic phased array systems can be used in virtually any test application, including crack detection and weld inspection. Such tests are performed across various sectors such as petrochemical, power generation, metal billet and tubular goods suppliers, structural metals, aerospace and pipeline construction and maintenance.

This information has been sourced, reviewed and adapted from materials provided by Evident Corporation.
For more information on this source, please visit Evident Corporation.