Proteins are susceptible to aggregation over time, which is considered a major problem in the biopharmaceutical industry. This is because the presence of aggregates will activate an immune response - a risky factor for biologic drugs.
Instrumentation
Size-exclusion chromatography (SEC) is a robust technique widely used to explore protein aggregation. The combination of a SEC tool and a light scattering enables performing molecular weight measurement of proteins irrespective of their retention volume. This, in turn, helps understanding the behavior of a protein sample by enabling the molecular weight measurement of the monomer, oligomers and aggregate present in the sample.
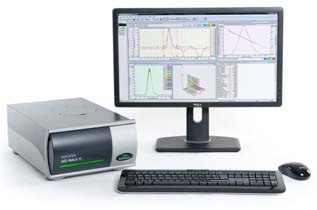
Figure 1. The Viscotek SEC-MALS 20 system.
The use of multi angle light scattering (MALS) enables the measurement of the radius of gyration (Rg) of molecules display anisotropic scattering. One such instrument shown in Figure 1 is the Viscotek SEC-MALS 20 system, a 20 angle light scattering device that can measure the molecular weight of protein and protein aggregates regardless of elution volume. The addition of more detectors including dynamic light scattering (DLS), intrinsic viscosity (IV), and concentration detectors (RI, UV) can help acquire more data from a single SEC measurement.
This article discusses the separation of selected proteins using SEC and the subsequent SEC-MALS analysis to measure the molecular weights of their oligomers and aggregates.
Experimental Procedure
The TDA RI detector was used to connect the SEC-MALS 20 system to a Viscotek TDAmax system for concentration measurement. Samples were isolated along 2 x Viscotek protein columns. Phosphate buffered saline was used as the mobile phase, in which all the samples were dissolved.
Bovine serum albumin, a protein with a well characterised molecular weight, was used to calibrate the SEC-MALS system. The detectors and columns were maintained at 30 °C to achieve good separation and to optimize baseline stability.
Experimental Results
BSA samples typically contain monomer, oligomers and larger aggregates. The peaks of monomers, dimers and trimers are clearly visible and MALS has been used to accurately measure their molecular weights. Some amount of polydisperse higher order aggregates are also present in the sample. These aggregates cannot be individually resolved. The BSA chromatogram is shown in Figure 2 and the BSA measurement results are listed in Table 1.
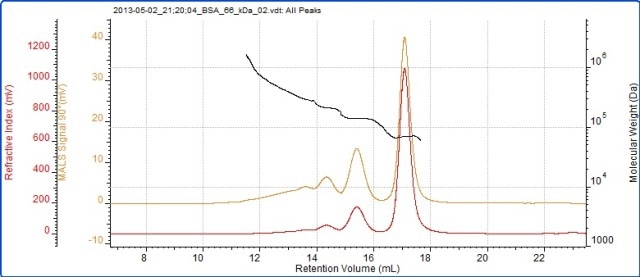
Figure 2. Chromatogram of BSA showing the refractive index (red) and SEC-MALS (90°) (orange) detector signals. The molecular weight measured by SEC-MALS is overlaid in black.
Table 1. Molecular weights of the different components of the BSA sample.
|
|
Aggregates |
Trimer |
Dimer |
Monomer |
| Peak RV - (ml) |
13.84 |
14.31 |
15.37 |
17.05 |
| Mn - (kDa) |
337.3 |
199.4 |
133.6 |
66.1 |
| Mw - (kDa) |
378.3 |
201.2 |
133.9 |
66.3 |
| Mw / Mn |
1.122 |
1.009 |
1.003 |
1.002 |
| Rg(w) - (nm) |
N/C |
N/C |
N/C |
N/C |
| Wt Fr (Peak) |
0.04 |
0.057 |
0.423 |
0.745 |
The molecular weights across the peaks of monomers, dimers and trimers are highly stable, indicating that they are monodisperse. If the molecular weights are stable, then they are oligomers. The molecular weight trace is highly variable in the earliest eluting material which is composed of a more polydisperse population. This is the characteristic of denatured aggregates that are unlikely to be active. The fraction of the total sample in each peak is determined in the ‘Wt Fr’ row.
Thyroglobulin was the second protein analyzed and its chromatogram is shown in Figure 3. The MALS signals obtained from the different angles can be observed in the MALS plot (Figure 4), and the measured results are listed in Table 2.
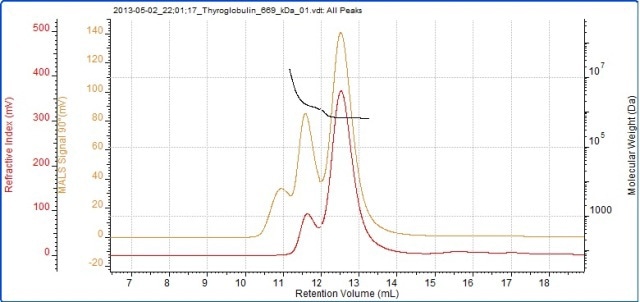
Figure 3. Chromatogram of thyroglobulin showing the refractive index (red) and SEC-MALS (90°) (orange) detector signals. The molecular weight measured by SEC-MALS is overlaid in black.
Figure 4. Chromatogram of SEC-MALS detector signals for thyroglobulin.
Table 2. Measured molecular weights of the different peaks of the thyroglobulin sample.
|
|
Aggregates |
Monomer |
| Peak RV - (ml) |
11.60 |
12.50 |
| Mn - (kDa) |
1601.0 |
681.5 |
| Mw - (kDa) |
2588.0 |
686.0 |
| Mw / Mn |
1.617 |
1.007 |
| Rg(w) - (nm) |
N/C |
N/C |
| Wt Fr (Peak) |
0.167 |
0.833 |
According to the RI detector, the thyroglobulin sample is divided into two peaks, but three peaks are detected by the SEC-MALS detector. A trace quantity of very large aggregates is identified by the SEC-MALS detector, but the RI detector is only able to see them. The monomer molecular weight is 686 kDa, which is within 3% of thyroglobulin molecular weight of 669 kDa. The stability across the monomer peak indicates that this population is monodisperse.
The aggregate peaks, analyzed as a single component, demonstrate higher and more variable molecular weight (polydisperse), indicating that they are disordered aggregates. The aggregates represent roughly 17% of the sample. Although the protein has high molecular weight, the SEC-MALS is able to reveal that the scattering from the monomer and the aggregates is isotropic. As such, it is impossible to determine the Rg of any of the peaks in this sample.
Pepsin was the final sample analyzed and its chromatogram is shown in Figure 5. The SEC-MALS signals obtained from the different angles can be observed in the MALS plot (Figure 6), and the measured results are listed in Table 3.
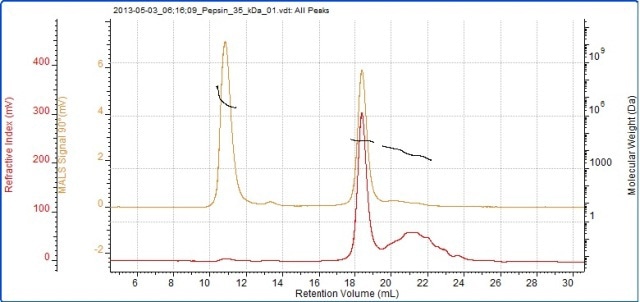
Figure 5. Chromatogram of pepsin showing the refractive index (red) and SEC-MALS (90°) (orange) detector signals. The molecular weight measured by SEC-MALS is overlaid in black.
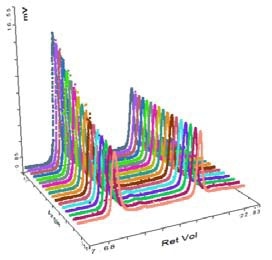
Figure 6. Chromatogram of SEC-MALS detector signals for pepsin.
Table 3. Measured molecular weights of the different peaks of the pepsin sample.
|
|
Aggregates |
Monomer |
Degradation products |
| Peak RV - (ml) |
10.84 |
18.33 |
20.92 |
| Mn - (kDa) |
3892.0 |
34.4 |
4.7 |
| Mw - (kDa) |
4431.0 |
34.7 |
6.4 |
| Mw / Mn |
1.138 |
1.008 |
1.364 |
| Rg(w) - (nm) |
69.9 |
N/C |
N/C |
| Wt Fr (Peak) |
0.008 |
0.569 |
0.423 |
The pepsin sample has been divided into two main peaks, of which the second peak has a measured molecular weight of 34.7 kDa, which is very near to pepsin’s known molecular weight of 35 kDa. The molecular weight of the larger peak is much higher and more variable, clearly indicating that it has some disordered aggregates that are likely to no longer be functional.
Although it is such a large light scattering peak, the aggregates represent below 1% of the total material in the sample. According to the MALS plot, these aggregates are strongly anisotropic scatterers, thus enabling the measurement of their Rg. The measured Rg value shown in the table is around 70 nm.
Pepsin has a nonglobular structure, meaning that it is larger than generally expected for a protein having that molecular weight. The aggregate size illustrates that the structure actually lasts in the aggregates before they become very large. The pepsin monomer is not large enough for Rg measurement. Although the third peak in the sample is not well defined, its molecular weight can be measured (roughly 6 kDa).
Conclusion
The results clearly demonstrate the ability of the Viscotek SEC-MALS 20 system to provide measurement of the molecular weight and aggregate content of various proteins.

This information has been sourced, reviewed and adapted from materials provided by Malvern Panalytical.
For more information on this source, please visit Malvern Panalytical.