B&W Tek has introduced the Quest™ X linear CCD array spectrometer that has been improved for NIR and UV performance through a low stray light optical bench.
The Quest™ X spectrometer features a built-in 16-bit digitizer, a 2048 element detector, an external trigger and a USB 2.0 interface with a readout speed of over 2.0 MHz.
The temperature-compensated Quest™ X significantly decreases the thermal drift to around 15 counts/°C. This offers enhanced stability by reducing the baseline drift and preserving the dynamic range.
The Quest™ X spectrometer is well-suited for a majority of the NIR, Vis and UV applications with resolutions ranging from 0.5 to 4.0 nm and spectral configurations between 200 and 1050.
Customized configurations and the RS232 communication interface are also provided for OEM applications. The Quest™ X spectrometer is an important building block for complete solutions. For OEM applications, system development and application support are also available.
Applications
- Wavelength identification
- Reflectance
- Absorbance
- NIR, Vis, and UV—spectroscopy/spectrophotometry/spectroradiometry
- OEM optical instrumentation component
Features
- Plug-and-play USB 2.0
- A 16-bit digitizer
- A spectral resolution of more than 0.5 nm
- UV to NIR (200–1050 nm)
- A readout speed of more than 2.0 MHz
- A minimum integration time of 1 ms
Accessories
- Fiber-optic probes
- Fiber patch cords
- Cuvette holders
- Light sources
- Inline filter holders
Software
The BWSpec® spectral data acquisition software has been specifically developed to execute complex calculations and measurements at the touch of a button. With this software, users can select between numerous data formats and optimize scanning parameters, like the integration time.
Apart from sturdy data processing and data acquisition, other features of the BWSpec® software include manual/automatic baseline correction, spectrum smoothing and automatic dark removal.
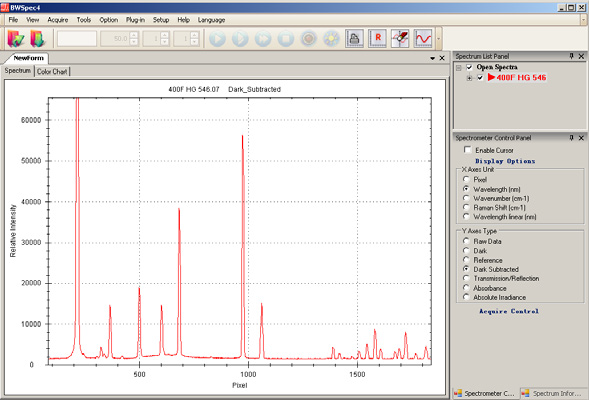
Image Credit: B&W Tek
Specifications
Table 1. Source: B&W Tek
| . |
. |
| Power Input |
USB @ < 0.35 Amps |
| Detector Type |
Response-Enhanced Linear CCD Array |
| Detector Pixel Format |
2048 x 1 Elements @ 14 µm x 200 µm Per Element |
| Spectrograph f/# |
3.6 |
| Spectrograph Optical Layout |
Crossed Czerny-Turner |
| Dynamic Range |
1300:1 Single Acquisition |
| Digitizer Resolution |
16-bit or 65,535:1 |
| Readout Speed |
>2.0 MHz |
| Data Transfer Speed |
Up to 480 Spectra Per Second Via USB 2.0 |
| Integration Time |
1 - 65,535 ms |
| Thermal Drift |
~15 Counts/oC (~29 Counts/oC Max) |
| Aux Port |
External Trigger, Digital IOs |
| Operating Temperature |
5 °C - 35 °C |
| Operational Relative Humidity |
85% Noncondensing |
| Weight |
~ 0.75 lbs (0.34 kg) |
| Dimensions |
3.82 in x 2.64 in x 1.34 in (98 mm x 67 mm x 34 mm) |
| Computer Interface |
USB 2.0 / 1.1 and Enhanced RS232 |
| Operating Systems |
Windows: XP, 7, 8, 10 (32-bit & 64-bit) |
Technical Details of Quest™ X
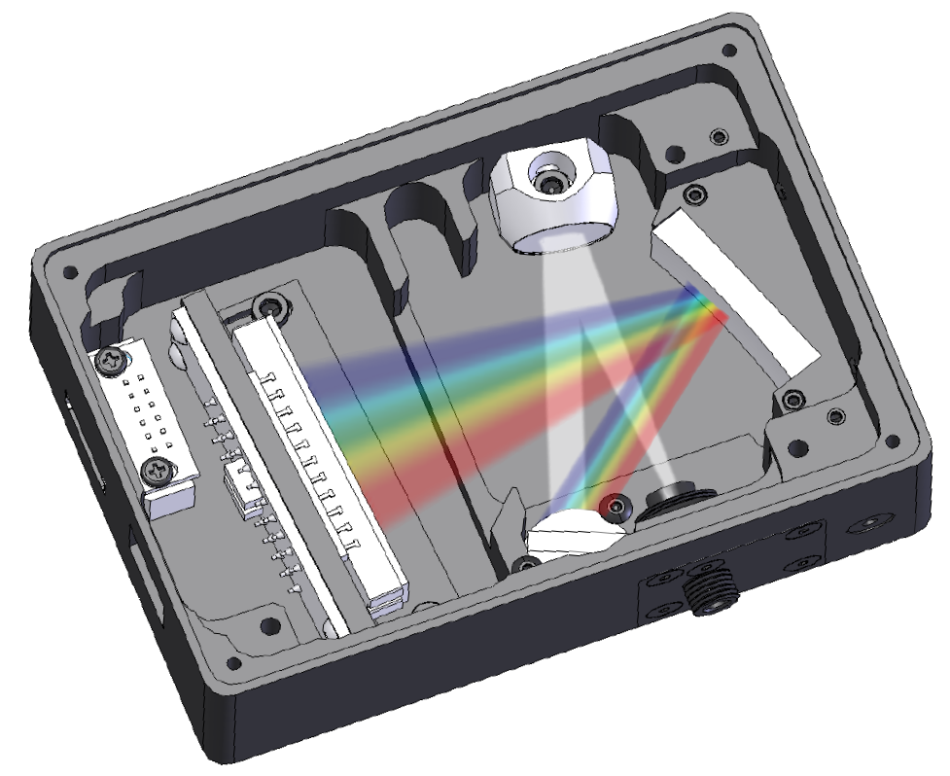
Image Credit: B&W Tek
1. Fiber Coupler
Secures Fiber to Ensure Repeatable Results
When a fiber optic is combined with the SMA 905 adaptor, light is directed toward the slit and optically matched, thus assuring reproducibility. A lens or diffuser assembly can be directly connected to the SMA 905 adaptor to facilitate free-space sampling.
2. Entrance Slit
Determines Photon Flux and Spectral Resolution
Light penetrating the optical bench of a spectrometer is vignetted by an aligned and pre-mounted slit. This eventually establishes the throughput and spectral resolution of the spectrometer following the selection of gratings. A wide range of slit widths is offered by B&W Tek to suit the particular application requirements of users. Custom-made slits are also available.
Table 2. Source: B&W Tek
Slit
Option |
Dimensions |
Approx. Resolution
350-1050 nm |
| 10 µm |
10 µm wide x 1 mm high |
~1.0 nm |
| 25 µm |
25 µm wide x 1 mm high |
~1.5 nm |
| 50 µm |
50 µm wide x 1 mm high |
~2.2 nm |
| 100 µm |
100 µm wide x 1 mm high |
~4.0 nm |
| 200 µm |
200 µm wide x 1 mm high |
Call |
| Custom Slit Widths Available |
3. Collimating Mirror
Collimates and Redirects Light Towards Grating
Both mirrors are f/# matched focusing mirrors and coated with AlMg2, which creates a reflectance of about 95% when operating in the UV-Vis spectrum. While aluminum (Al) offers reflectance, magnesium (Mg2) protects the former against oxidation.
4. Diffraction Grating
Diffracts Light, Separating Spectral Components
Two major aspects of the performance of the spectrometer are determined by the groove frequency of the grating. These aspects include the spectral resolution and the wavelength coverage.
Upon increasing the groove frequency, the spectrometer will achieve higher resolution; however, the wavelength coverage will also reduce simultaneously. Inversely, decreased groove frequency translates to increased wavelength coverage, affecting the spectral resolution.
The blaze wavelength or blaze angle of the grating is the main parameter for improving the performance of the spectrometer. It is the blaze angle that decides the maximum efficiency exhibited by the grating in a certain wavelength region.
Table 3. Source: B&W Tek
| Best Efficiency |
Spectral Coverage (nm) |
Grating |
| UV / NIR |
200 - 850 |
600/250 |
| UV / NIR |
350 - 1050 |
600/400 |
| Vis |
380 - 750 |
900/500 |
| Vis / NIR |
550 - 1050 |
830/800 |
| NIR |
750 - 1050 |
1200/750 |
| Custom Configurations Available |
5. Focusing Mirror
Refocuses Dispersed Light onto Detector
Both mirrors are f/# matched focusing mirrors and coated with AlMg2, which generates a reflectance of approximately 95% when operating in the UV-Vis spectrum. While aluminum (Al) offers reflectance, magnesium (Mg2) protects the former from oxidation.
6. Array Detector
Measures Entire Spectrum Simultaneously
The Quest™ X spectrometer includes a 2048 x 1 linear CCD array detector with a pixel width of 14 µm and over 2000 active pixels.
When the individual pixels across the CCD are struck by the incident light, every pixel denotes a spectral portion that is translated and displayed by the electronics with a specified intensity using the BWSpec® software. The noise level and quantum efficiency (QE) of the array detector substantially affects the signal-to-noise ratio, dynamic range and sensitivity of the spectrometer. Furthermore, the spectral acquisition speed of the spectrometer is chiefly established by the detector response across a wavelength region.
Table 4. Source: B&W Tek
| Specifications |
| Wavelength Range |
200 nm - 1050 nm |
| Pixels |
2048 |
| Pixel Size |
14 µm x 200 µm |
| Well Depth |
~65,000 e |
| Digitization Rate |
>2.0 MHz |
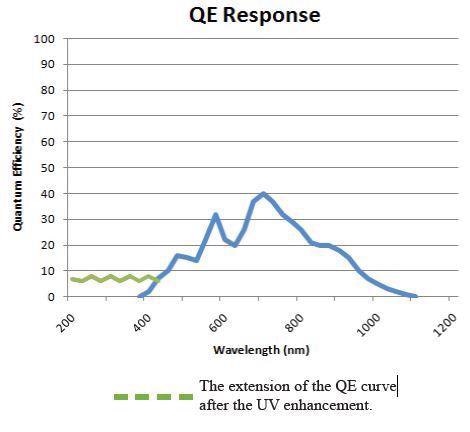
Image Credit: B&W Tek